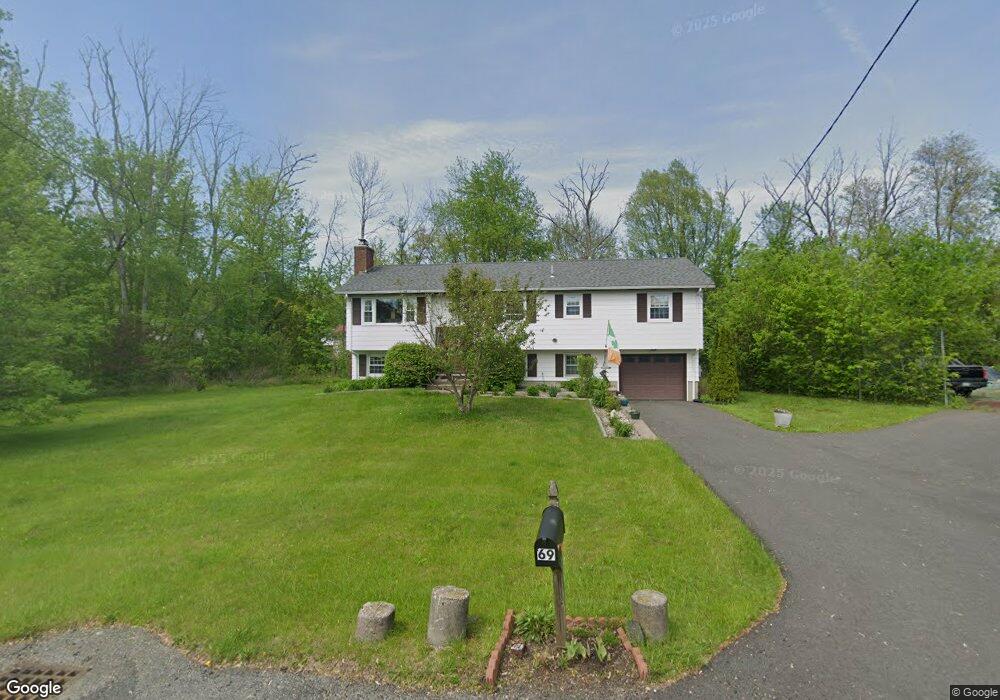
69 Salem St West Springfield, MA 01089
Estimated Value: $372,000 - $383,000
3
Beds
2
Baths
1,286
Sq Ft
$293/Sq Ft
Est. Value
About This Home
This home is located at 69 Salem St, West Springfield, MA 01089 and is currently estimated at $377,383, approximately $293 per square foot. 69 Salem St is a home located in Hampden County with nearby schools including West Springfield High School and St Thomas The Apostle School.
Ownership History
Date
Name
Owned For
Owner Type
Purchase Details
Closed on
Jul 14, 2006
Sold by
Therrien Jean E and Schachter Barry
Bought by
Ryan Kevin G
Current Estimated Value
Home Financials for this Owner
Home Financials are based on the most recent Mortgage that was taken out on this home.
Original Mortgage
$180,000
Outstanding Balance
$107,215
Interest Rate
6.71%
Mortgage Type
Purchase Money Mortgage
Estimated Equity
$270,168
Create a Home Valuation Report for This Property
The Home Valuation Report is an in-depth analysis detailing your home's value as well as a comparison with similar homes in the area
Home Values in the Area
Average Home Value in this Area
Purchase History
| Date | Buyer | Sale Price | Title Company |
|---|---|---|---|
| Ryan Kevin G | $226,000 | -- |
Source: Public Records
Mortgage History
| Date | Status | Borrower | Loan Amount |
|---|---|---|---|
| Open | Ryan Kevin G | $180,000 |
Source: Public Records
Tax History
| Year | Tax Paid | Tax Assessment Tax Assessment Total Assessment is a certain percentage of the fair market value that is determined by local assessors to be the total taxable value of land and additions on the property. | Land | Improvement |
|---|---|---|---|---|
| 2025 | $5,078 | $341,500 | $139,900 | $201,600 |
| 2024 | $5,075 | $342,700 | $139,900 | $202,800 |
| 2023 | $4,594 | $295,600 | $139,900 | $155,700 |
| 2022 | $4,249 | $269,600 | $127,000 | $142,600 |
| 2021 | $4,115 | $243,500 | $121,000 | $122,500 |
| 2020 | $4,093 | $240,900 | $121,000 | $119,900 |
| 2019 | $4,086 | $240,900 | $121,000 | $119,900 |
| 2018 | $4,107 | $240,900 | $121,000 | $119,900 |
| 2017 | $4,107 | $240,900 | $121,000 | $119,900 |
| 2016 | $4,011 | $236,100 | $116,500 | $119,600 |
| 2015 | $3,933 | $231,500 | $114,100 | $117,400 |
| 2014 | $955 | $231,500 | $114,100 | $117,400 |
Source: Public Records
Map
Nearby Homes
- 88 Verdugo St
- 65 Verdugo St
- 62 Talcott Ave
- 240 Morton St
- 61 Clarence St
- 65 Churchill Rd
- 1996 Westfield St
- 750 Amostown Rd
- 32 Glenview Dr
- 0 Ahiska Rd Unit 73477754
- 81 Chestnut St
- 144 Almon Ave
- 117 Sibley Ave
- 32 Maple St
- 128 Hampden St
- 31 North Blvd
- 791 Morgan Rd
- 34 High Meadow Dr
- 115 Grove St
- 24 Hampden St
Your Personal Tour Guide
Ask me questions while you tour the home.