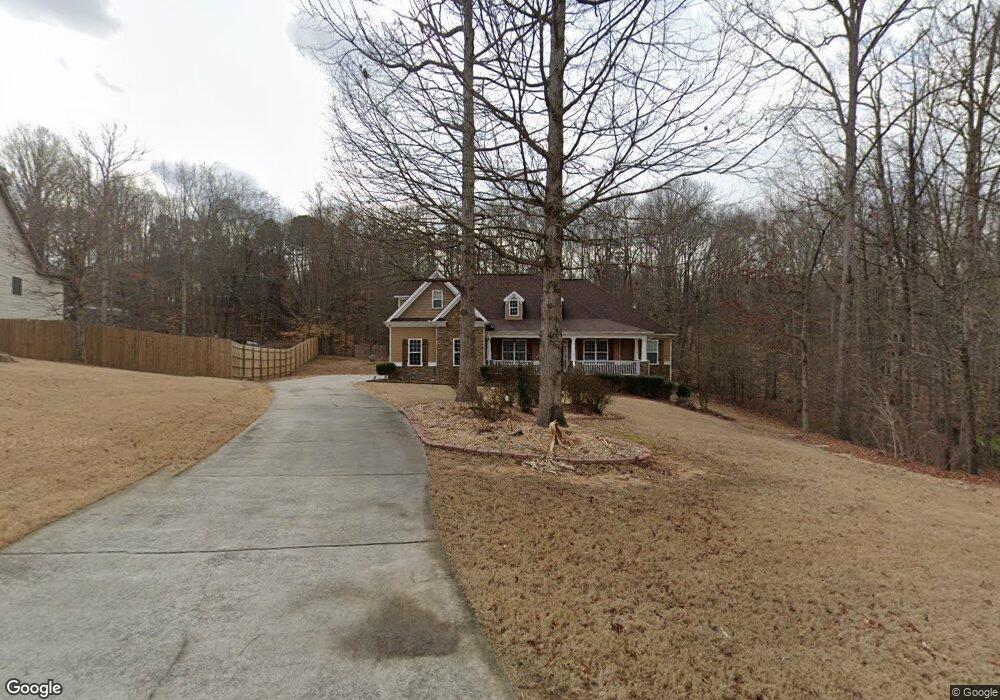
69 Seattle Slew Walk Unit 18 Jefferson, GA 30549
Estimated Value: $551,000 - $596,173
5
Beds
5
Baths
5,246
Sq Ft
$111/Sq Ft
Est. Value
About This Home
This home is located at 69 Seattle Slew Walk Unit 18, Jefferson, GA 30549 and is currently estimated at $580,724, approximately $110 per square foot. 69 Seattle Slew Walk Unit 18 is a home located in Jackson County with nearby schools including Gum Springs Elementary School, West Jackson Middle School, and Jackson County High School.
Ownership History
Date
Name
Owned For
Owner Type
Purchase Details
Closed on
May 29, 2015
Sold by
Chapman April
Bought by
Chunasamy Rakesh and Chunasamy Latadevi
Current Estimated Value
Home Financials for this Owner
Home Financials are based on the most recent Mortgage that was taken out on this home.
Original Mortgage
$301,500
Outstanding Balance
$233,853
Interest Rate
3.79%
Mortgage Type
New Conventional
Estimated Equity
$346,871
Purchase Details
Closed on
Dec 14, 2006
Sold by
Not Provided
Bought by
Chapman James and Chapman April
Home Financials for this Owner
Home Financials are based on the most recent Mortgage that was taken out on this home.
Original Mortgage
$260,396
Interest Rate
6.48%
Mortgage Type
New Conventional
Purchase Details
Closed on
Aug 5, 2005
Sold by
Gary
Bought by
Dns Construction Inc
Create a Home Valuation Report for This Property
The Home Valuation Report is an in-depth analysis detailing your home's value as well as a comparison with similar homes in the area
Home Values in the Area
Average Home Value in this Area
Purchase History
| Date | Buyer | Sale Price | Title Company |
|---|---|---|---|
| Chunasamy Rakesh | $335,000 | -- | |
| Chapman James | $325,500 | -- | |
| Dns Construction Inc | $500,000 | -- |
Source: Public Records
Mortgage History
| Date | Status | Borrower | Loan Amount |
|---|---|---|---|
| Open | Chunasamy Rakesh | $301,500 | |
| Previous Owner | Chapman James | $260,396 | |
| Previous Owner | Chapman James | $65,099 |
Source: Public Records
Tax History Compared to Growth
Tax History
| Year | Tax Paid | Tax Assessment Tax Assessment Total Assessment is a certain percentage of the fair market value that is determined by local assessors to be the total taxable value of land and additions on the property. | Land | Improvement |
|---|---|---|---|---|
| 2024 | $5,610 | $232,960 | $24,000 | $208,960 |
| 2023 | $5,610 | $210,560 | $24,000 | $186,560 |
| 2022 | $4,804 | $174,760 | $24,000 | $150,760 |
| 2021 | $4,839 | $174,760 | $24,000 | $150,760 |
| 2020 | $4,480 | $147,560 | $24,000 | $123,560 |
| 2019 | $4,550 | $147,560 | $24,000 | $123,560 |
| 2018 | $3,507 | $112,560 | $24,000 | $88,560 |
| 2017 | $3,273 | $104,187 | $24,000 | $80,187 |
| 2016 | $3,351 | $104,187 | $24,000 | $80,187 |
| 2015 | $2,855 | $90,187 | $10,000 | $80,187 |
| 2014 | -- | $85,531 | $10,000 | $75,531 |
| 2013 | -- | $85,531 | $10,000 | $75,531 |
Source: Public Records
Map
Nearby Homes
- 69 Seattle Slew Walk
- 57 Seattle Slew Walk
- 115 Seattle Slew Walk
- 0 Seattle Slew Walk Unit 8933020
- 0 Seattle Slew Walk Unit 7249015
- 0 Seattle Slew Walk
- 43 Seattle Slew Walk
- 72 Seattle Slew Walk
- 50 Seattle Slew Walk
- 347 Whirlaway St
- 120 Seattle Slew Walk
- 303 Whirlaway St
- 297 Whirlaway St
- 127 Seattle Slew Walk
- 28 Seattle Slew Walk
- 28 Preakness Trail
- 511 Whirlaway St
- 340 Whirlaway St
- 320 Whirlaway St
- 398 Whirlaway St