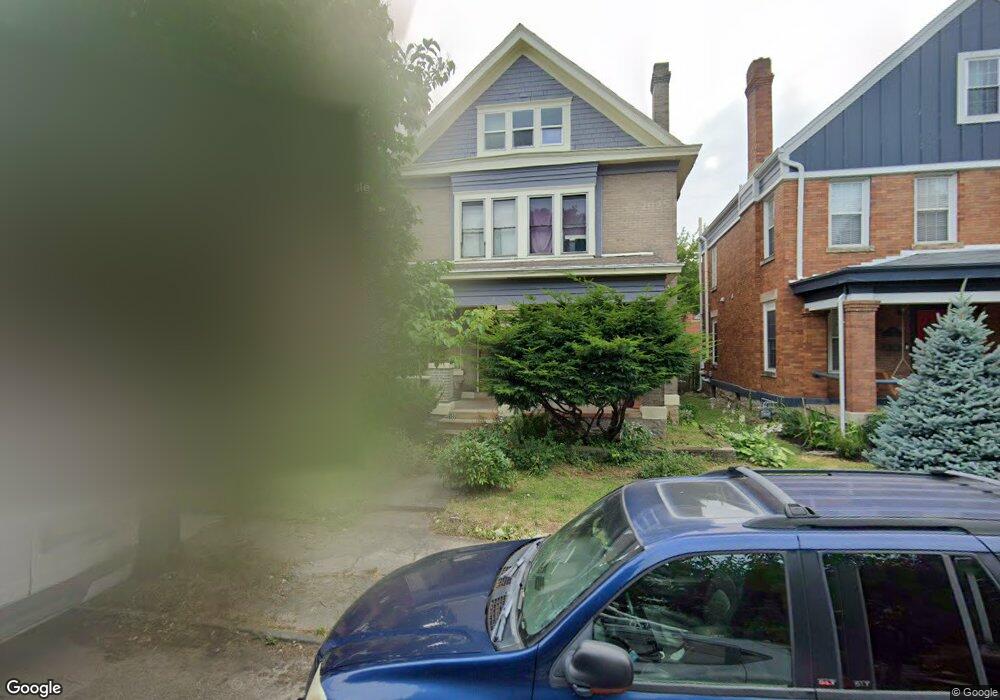
69 Sherman Ave Columbus, OH 43205
Olde Towne East NeighborhoodEstimated Value: $329,000 - $375,000
4
Beds
3
Baths
2,252
Sq Ft
$154/Sq Ft
Est. Value
About This Home
This home is located at 69 Sherman Ave, Columbus, OH 43205 and is currently estimated at $345,742, approximately $153 per square foot. 69 Sherman Ave is a home located in Franklin County with nearby schools including Ohio Avenue Elementary School, Champion Middle School, and East High School.
Ownership History
Date
Name
Owned For
Owner Type
Purchase Details
Closed on
Sep 26, 2025
Sold by
Turner Leslie J
Bought by
Sulima Homes Llc
Current Estimated Value
Home Financials for this Owner
Home Financials are based on the most recent Mortgage that was taken out on this home.
Original Mortgage
$308,000
Outstanding Balance
$283,096
Interest Rate
6.56%
Mortgage Type
Construction
Estimated Equity
$62,646
Purchase Details
Closed on
May 12, 2005
Sold by
Hirschhorn Lee M
Bought by
Turner Leslie J
Home Financials for this Owner
Home Financials are based on the most recent Mortgage that was taken out on this home.
Original Mortgage
$104,000
Interest Rate
6.37%
Mortgage Type
Fannie Mae Freddie Mac
Purchase Details
Closed on
Jun 18, 2004
Sold by
Cook Gregory F and Wells Fargo Bank Minnesota Na
Bought by
Hirschhorn Lee M
Home Financials for this Owner
Home Financials are based on the most recent Mortgage that was taken out on this home.
Original Mortgage
$66,600
Interest Rate
7.5%
Mortgage Type
Purchase Money Mortgage
Purchase Details
Closed on
Oct 21, 1999
Sold by
Cook Janice D
Bought by
Cook Gregory F
Purchase Details
Closed on
Sep 20, 1982
Bought by
Cook Gregory F
Create a Home Valuation Report for This Property
The Home Valuation Report is an in-depth analysis detailing your home's value as well as a comparison with similar homes in the area
Home Values in the Area
Average Home Value in this Area
Purchase History
| Date | Buyer | Sale Price | Title Company |
|---|---|---|---|
| Sulima Homes Llc | $330,000 | Total Title Services | |
| Turner Leslie J | $95,000 | -- | |
| Hirschhorn Lee M | $74,000 | -- | |
| Cook Gregory F | -- | -- | |
| Cook Gregory F | -- | -- |
Source: Public Records
Mortgage History
| Date | Status | Borrower | Loan Amount |
|---|---|---|---|
| Open | Sulima Homes Llc | $308,000 | |
| Previous Owner | Turner Leslie J | $104,000 | |
| Previous Owner | Hirschhorn Lee M | $66,600 |
Source: Public Records
Tax History Compared to Growth
Tax History
| Year | Tax Paid | Tax Assessment Tax Assessment Total Assessment is a certain percentage of the fair market value that is determined by local assessors to be the total taxable value of land and additions on the property. | Land | Improvement |
|---|---|---|---|---|
| 2024 | $3,225 | $81,660 | $31,610 | $50,050 |
| 2023 | $3,212 | $81,655 | $31,605 | $50,050 |
| 2022 | $2,077 | $48,800 | $5,150 | $43,650 |
| 2021 | $2,597 | $58,740 | $5,150 | $53,590 |
| 2020 | $1,945 | $37,390 | $5,150 | $32,240 |
| 2019 | $1,743 | $28,740 | $4,130 | $24,610 |
| 2018 | $1,729 | $28,740 | $4,130 | $24,610 |
| 2017 | $1,817 | $28,740 | $4,130 | $24,610 |
| 2016 | $1,892 | $28,560 | $3,500 | $25,060 |
| 2015 | $1,717 | $28,560 | $3,500 | $25,060 |
| 2014 | $1,722 | $28,560 | $3,500 | $25,060 |
| 2013 | $772 | $25,970 | $3,185 | $22,785 |
Source: Public Records
Map
Nearby Homes
- 1214 Madison Ave
- 1262 Fair Ave
- 43 Winner Ave
- 122 S Ohio Ave Unit 2
- 1090 Fair Ave
- 1258 Oak St
- 127 S Ohio Ave Unit 19
- 1070 Fair Ave
- 1271 E Long St
- 100 N 22nd St
- 1275 E Long St
- 1318 Oak St
- 203-5 N 21st St Unit 203
- 1179 Franklin Ave
- 1096 Franklin Ave
- 1217 Franklin Ave Unit 219
- 1035 Madison Ave
- 1095 Franklin Ave
- 1093 Franklin Ave
- 181 S Ohio Ave
- 73 Sherman Ave
- 65 Sherman Ave
- 1225 Madison Ave
- 61 Sherman Ave
- 1473 Sherman Ave
- 77 Sherman Ave
- 1223 Madison Ave
- 1220 Fair Ave
- 1211 Madison Ave
- 1224 Fair Ave
- 56 Sherman Ave
- 60 Sherman Ave Unit 62
- 1216 Fair Ave
- 43 Sherman Ave Unit 45
- 43-45 Sherman Ave
- 43 Sherman Ave Unit 43-45
- 0 Madison Ave
- 1440 Madison Ave Unit ID1072673P
- 1440 Madison Ave
- 66 Sherman Ave