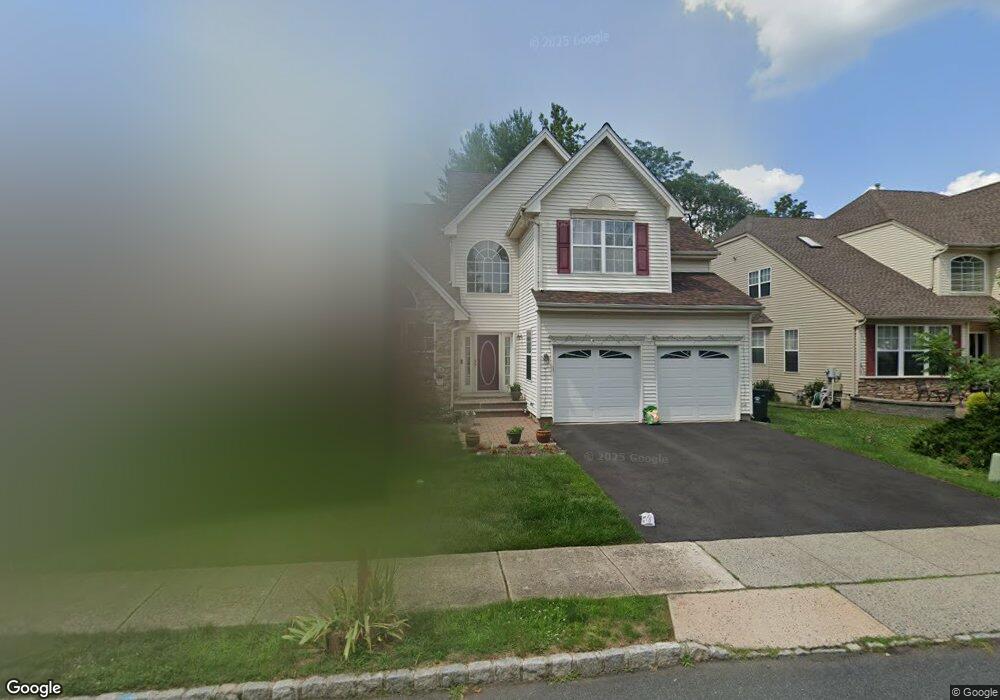
69 Shields Ln Bridgewater, NJ 08807
Estimated Value: $907,095 - $991,000
Studio
--
Bath
2,728
Sq Ft
$351/Sq Ft
Est. Value
About This Home
This home is located at 69 Shields Ln, Bridgewater, NJ 08807 and is currently estimated at $957,774, approximately $351 per square foot. 69 Shields Ln is a home located in Somerset County with nearby schools including Milltown School, Eisenhower Intermediate School, and Bridgewater-Raritan Middle School.
Ownership History
Date
Name
Owned For
Owner Type
Purchase Details
Closed on
Oct 6, 2006
Sold by
Jiang Wenlei
Bought by
Chen Wu and Lu Jia
Current Estimated Value
Home Financials for this Owner
Home Financials are based on the most recent Mortgage that was taken out on this home.
Original Mortgage
$490,000
Outstanding Balance
$292,877
Interest Rate
6.49%
Estimated Equity
$664,897
Purchase Details
Closed on
Dec 28, 2001
Sold by
Chen Lewen
Bought by
Jiang Wenlei and Shihwei Li
Home Financials for this Owner
Home Financials are based on the most recent Mortgage that was taken out on this home.
Original Mortgage
$332,000
Interest Rate
6.84%
Purchase Details
Closed on
Aug 7, 1998
Sold by
Eastern Hill
Bought by
Chen Lewen and Song Shao
Home Financials for this Owner
Home Financials are based on the most recent Mortgage that was taken out on this home.
Original Mortgage
$227,000
Interest Rate
6.9%
Create a Home Valuation Report for This Property
The Home Valuation Report is an in-depth analysis detailing your home's value as well as a comparison with similar homes in the area
Home Values in the Area
Average Home Value in this Area
Purchase History
| Date | Buyer | Sale Price | Title Company |
|---|---|---|---|
| Chen Wu | $612,500 | -- | |
| Jiang Wenlei | $415,000 | -- | |
| Chen Lewen | $300,871 | -- |
Source: Public Records
Mortgage History
| Date | Status | Borrower | Loan Amount |
|---|---|---|---|
| Open | Chen Wu | $490,000 | |
| Previous Owner | Jiang Wenlei | $332,000 | |
| Previous Owner | Chen Lewen | $227,000 |
Source: Public Records
Tax History
| Year | Tax Paid | Tax Assessment Tax Assessment Total Assessment is a certain percentage of the fair market value that is determined by local assessors to be the total taxable value of land and additions on the property. | Land | Improvement |
|---|---|---|---|---|
| 2025 | $15,825 | $804,500 | $287,200 | $517,300 |
| 2024 | $15,825 | $811,100 | $287,200 | $523,900 |
| 2023 | $14,671 | $739,100 | $287,200 | $451,900 |
| 2022 | $13,694 | $667,000 | $277,200 | $389,800 |
| 2021 | $12,876 | $620,400 | $277,200 | $343,200 |
| 2020 | $12,895 | $615,800 | $277,200 | $338,600 |
| 2019 | $12,876 | $608,800 | $277,200 | $331,600 |
| 2018 | $12,698 | $601,800 | $277,200 | $324,600 |
| 2017 | $12,402 | $587,200 | $267,200 | $320,000 |
| 2016 | $12,195 | $586,000 | $267,200 | $318,800 |
| 2015 | $12,141 | $583,700 | $267,200 | $316,500 |
| 2014 | $11,479 | $543,500 | $262,200 | $281,300 |
Source: Public Records
Map
Nearby Homes
- 4607 Patterson St
- 377 Hannah Way
- 22 Kershaw Ct
- 319 Hannah Way
- 351 Route 28
- 51 Bertran Dr
- 23 Huntley Way
- 307 Hannah Way
- 37 Shaffer Rd
- 25 Francis Dr
- 402 Porter Way W Unit 402
- 36 Murphy Dr
- 450 Vanderveer Rd
- 511 Dunn Cir Unit 11
- 1404 Pinhorn Dr
- 504 Reading Cir
- 46 Stillwell Ct
- 12 Lewis Dr
- 1905 Vroom Dr
- 1304 Palley Ct
Your Personal Tour Guide
Ask me questions while you tour the home.