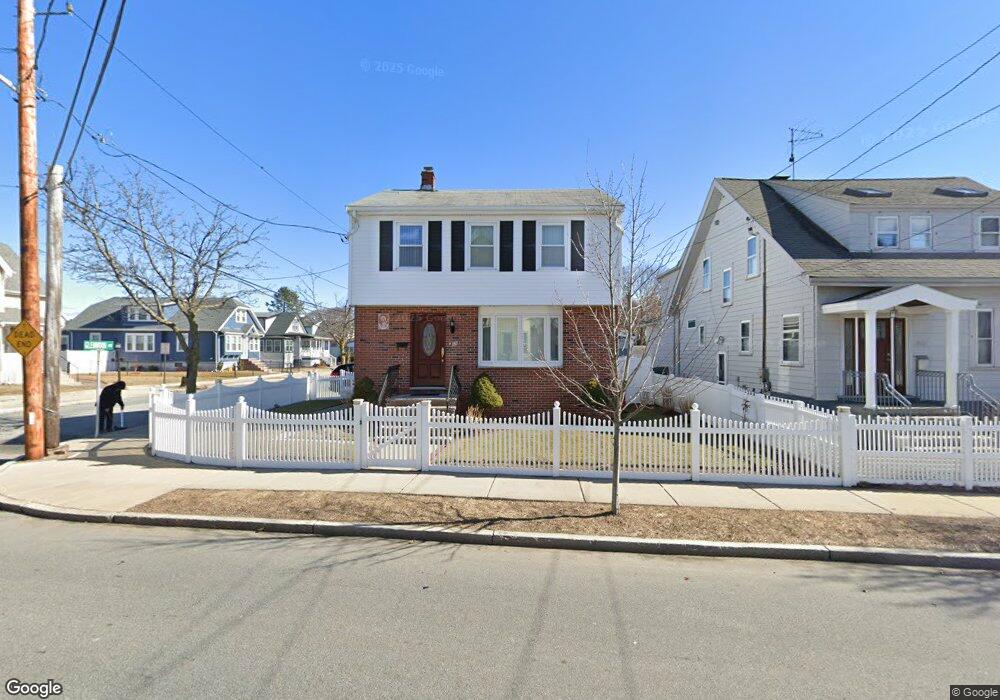
69 Spring St Medford, MA 02155
Glenwood NeighborhoodEstimated Value: $667,000 - $815,000
3
Beds
2
Baths
1,225
Sq Ft
$615/Sq Ft
Est. Value
About This Home
This home is located at 69 Spring St, Medford, MA 02155 and is currently estimated at $753,222, approximately $614 per square foot. 69 Spring St is a home located in Middlesex County with nearby schools including Medford High School, Mystic Valley Regional Charter School, and St. Joseph School.
Ownership History
Date
Name
Owned For
Owner Type
Purchase Details
Closed on
Oct 29, 2010
Sold by
Correia Jose P and Correia Maria A
Bought by
Correia Jose P and Correia Maria A
Current Estimated Value
Purchase Details
Closed on
Oct 27, 1989
Sold by
Scarpetta Vincent
Bought by
Correia Jose P
Home Financials for this Owner
Home Financials are based on the most recent Mortgage that was taken out on this home.
Original Mortgage
$25,000
Interest Rate
9.94%
Mortgage Type
Purchase Money Mortgage
Create a Home Valuation Report for This Property
The Home Valuation Report is an in-depth analysis detailing your home's value as well as a comparison with similar homes in the area
Home Values in the Area
Average Home Value in this Area
Purchase History
| Date | Buyer | Sale Price | Title Company |
|---|---|---|---|
| Correia Jose P | -- | -- | |
| Correia Jose P | $166,500 | -- |
Source: Public Records
Mortgage History
| Date | Status | Borrower | Loan Amount |
|---|---|---|---|
| Previous Owner | Correia Jose P | $25,000 |
Source: Public Records
Tax History Compared to Growth
Tax History
| Year | Tax Paid | Tax Assessment Tax Assessment Total Assessment is a certain percentage of the fair market value that is determined by local assessors to be the total taxable value of land and additions on the property. | Land | Improvement |
|---|---|---|---|---|
| 2025 | $5,121 | $581,900 | $325,800 | $256,100 |
| 2024 | $4,789 | $562,100 | $310,300 | $251,800 |
| 2023 | $4,559 | $527,000 | $290,000 | $237,000 |
| 2022 | $4,434 | $492,100 | $263,600 | $228,500 |
| 2021 | $4,293 | $456,200 | $251,100 | $205,100 |
| 2020 | $4,207 | $458,300 | $251,100 | $207,200 |
| 2019 | $4,168 | $434,200 | $228,200 | $206,000 |
| 2018 | $4,094 | $399,800 | $207,500 | $192,300 |
| 2017 | $3,960 | $375,000 | $193,900 | $181,100 |
| 2016 | $3,817 | $341,100 | $176,300 | $164,800 |
| 2015 | $3,694 | $315,700 | $167,900 | $147,800 |
Source: Public Records
Map
Nearby Homes
- 45 Grant Ave
- 42 Gibson St
- 55 Evans St
- 305 Riverside Ave Unit 41
- 216 Central Ave Unit 218
- 20 Ship Ave Unit 8
- 14 Park St
- 55 Surrey St
- 124 Grant Ave
- 179 Park St Unit 201
- 3 Pleasant St Unit 1
- 830 Fellsway
- 19 Paris St Unit 302
- 16 Walker St Unit 16
- 70 Tainter St
- 70 Tainter St Unit 1
- 32 Almont St Unit 32-1
- 320 Middlesex Ave Unit A207
- 320 Middlesex Ave Unit E403
- 320 Middlesex Ave Unit A406
- 65 Spring St
- 7 Glenwood Ave
- 66 Spring St
- 73 Spring St
- 73 Spring St Unit 1
- 73 Spring St Unit 2
- 61 Spring St
- 72 Spring St Unit 72
- 11 Glenwood Ave
- 74 Spring St
- 74 Spring St Unit 2
- 74 Spring St Unit 1
- 59 Spring St
- 70 Spring St
- 8 Sherman Ct
- 65 Bradshaw St
- 8 Glenwood Ave
- 60 Spring St
- 115 Magoun Ave
- 115 Magoun Ave Unit 2