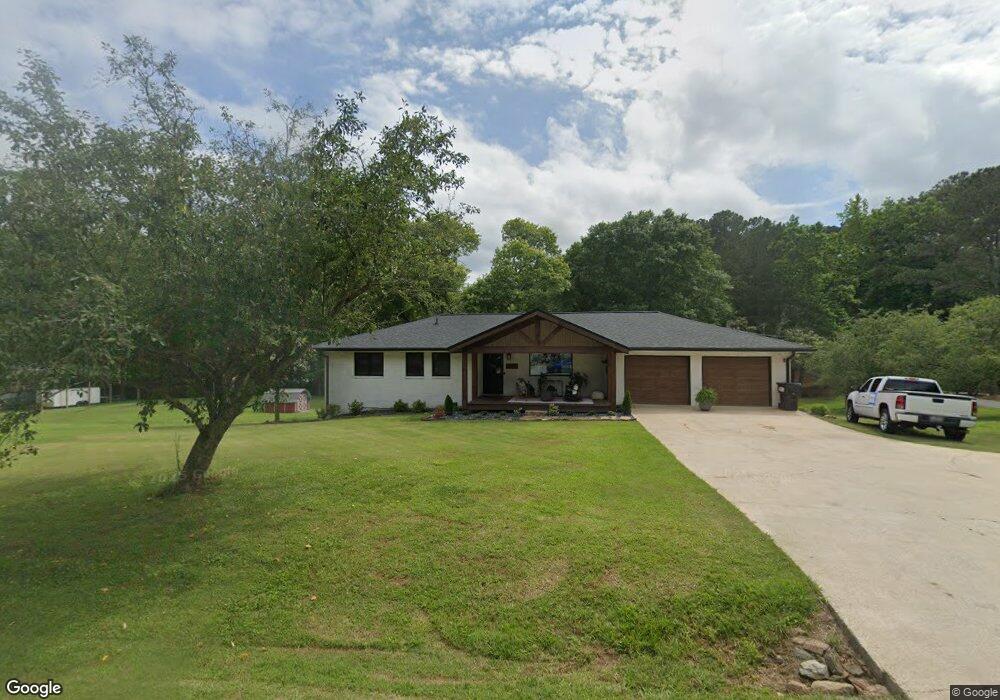
69 Spring Valley Ln Sharpsburg, GA 30277
Estimated Value: $262,919 - $300,000
3
Beds
2
Baths
1,442
Sq Ft
$196/Sq Ft
Est. Value
About This Home
This home is located at 69 Spring Valley Ln, Sharpsburg, GA 30277 and is currently estimated at $281,980, approximately $195 per square foot. 69 Spring Valley Ln is a home located in Coweta County with nearby schools including Thomas Crossroads Elementary School, Lee Middle School, and Northgate High School.
Ownership History
Date
Name
Owned For
Owner Type
Purchase Details
Closed on
Sep 1, 2021
Sold by
Galanti Jeremy B
Bought by
Galanti Jeremy Bruce and Galanti Amanda Nicole
Current Estimated Value
Home Financials for this Owner
Home Financials are based on the most recent Mortgage that was taken out on this home.
Original Mortgage
$246,667
Outstanding Balance
$184,513
Interest Rate
2.7%
Mortgage Type
New Conventional
Estimated Equity
$97,467
Purchase Details
Closed on
Jan 31, 2013
Sold by
Campbell Sandra Lea
Bought by
Harris George S
Home Financials for this Owner
Home Financials are based on the most recent Mortgage that was taken out on this home.
Original Mortgage
$107,219
Interest Rate
3.25%
Mortgage Type
FHA
Purchase Details
Closed on
Jun 18, 2006
Sold by
Lavergnerobert G
Bought by
Lavergne Sandra Lea
Purchase Details
Closed on
Feb 9, 1994
Bought by
Lavergne Sandra Lea
Purchase Details
Closed on
Nov 30, 1971
Bought by
Gilliam Gilliam J and Gilliam France
Create a Home Valuation Report for This Property
The Home Valuation Report is an in-depth analysis detailing your home's value as well as a comparison with similar homes in the area
Home Values in the Area
Average Home Value in this Area
Purchase History
| Date | Buyer | Sale Price | Title Company |
|---|---|---|---|
| Galanti Jeremy Bruce | -- | -- | |
| Harris George S | $115,000 | -- | |
| Lavergne Sandra Lea | -- | -- | |
| Lavergne Sandra Lea | $89,900 | -- | |
| Gilliam Gilliam J | $1,900 | -- |
Source: Public Records
Mortgage History
| Date | Status | Borrower | Loan Amount |
|---|---|---|---|
| Open | Galanti Jeremy Bruce | $246,667 | |
| Previous Owner | Harris George S | $107,219 |
Source: Public Records
Tax History Compared to Growth
Tax History
| Year | Tax Paid | Tax Assessment Tax Assessment Total Assessment is a certain percentage of the fair market value that is determined by local assessors to be the total taxable value of land and additions on the property. | Land | Improvement |
|---|---|---|---|---|
| 2025 | $2,127 | $90,039 | $13,104 | $76,934 |
| 2024 | $1,786 | $76,950 | $12,247 | $64,703 |
| 2023 | $1,786 | $64,777 | $11,340 | $53,437 |
| 2022 | $1,491 | $60,532 | $10,800 | $49,732 |
| 2021 | $1,484 | $56,351 | $10,800 | $45,551 |
| 2020 | $1,493 | $56,351 | $10,800 | $45,551 |
| 2019 | $1,531 | $52,296 | $12,170 | $40,126 |
| 2018 | $1,533 | $52,296 | $12,170 | $40,126 |
| 2017 | $1,011 | $39,266 | $8,565 | $30,701 |
| 2016 | $1,001 | $39,266 | $8,565 | $30,701 |
| 2015 | $987 | $39,266 | $8,565 | $30,701 |
| 2014 | $1,289 | $39,266 | $8,565 | $30,701 |
Source: Public Records
Map
Nearby Homes
- 10 Fisher Way
- 0 Maple Trail
- 2039 Fischer Rd
- 68 Timbercreek Estates Dr
- 2043 Fischer Rd
- 75 Tomahawk Dr
- 75 Kripple Kreek Dr
- 136 Barrington Grange Dr
- 200 Barrington Grange Dr
- 125 Cannongate Cir
- 50 Barrington Grange Ct
- 319 Le Paradis Blvd
- 10 Queens Ct
- 131 Cannongate Cir
- 12 Race Point Way
- 395 Beaumont Farms Dr
- 95 Tyler Woods Dr
- 65 Barrington Ridge Ct
- 374 Beaumont Farms Dr
- 9 Platinum Overlook
- 72 Spring Valley Ln
- 18 Rollingwood Trail
- 26 Rollingwood Trail
- 86 Spring Valley Ln
- 1805 Fischer Rd
- 1805 Fischer Rd
- 6 Rollingwood Trail
- 55 Rollingwood Trail
- 122 Spring Valley Ln
- 1763 Fischer Rd
- 1855 Fischer Rd Unit 2.09AC
- 1855 Fischer Rd
- 89 Rollingwood Trail
- 0 Bailey Way
- 0 Bailey Way Unit 10128994
- 0 Bailey Way Unit 14A 8588296
- 1844 Fischer Rd
- 00 Hammett Cir
- 46 Rollingwood Trail
- 0 Rollingwood Trail