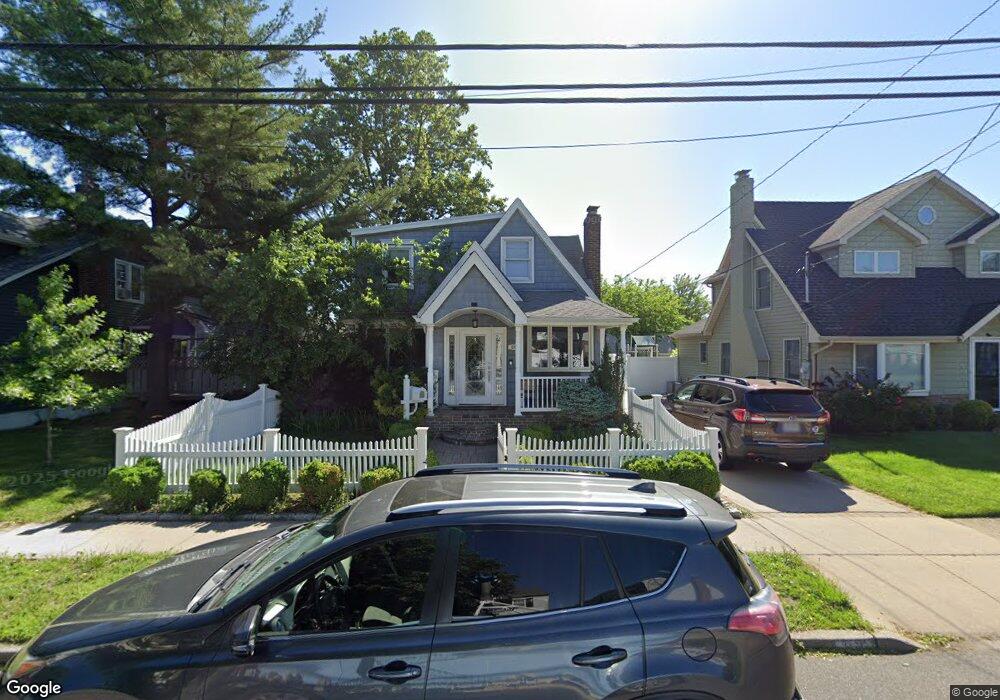
69 Spruce St West Hempstead, NY 11552
Estimated Value: $746,834 - $841,000
--
Bed
2
Baths
1,675
Sq Ft
$474/Sq Ft
Est. Value
About This Home
This home is located at 69 Spruce St, West Hempstead, NY 11552 and is currently estimated at $793,917, approximately $473 per square foot. 69 Spruce St is a home located in Nassau County with nearby schools including Chestnut Street School, West Hempstead Secondary School, and Hebrew Academy of Nassau County (HANC).
Ownership History
Date
Name
Owned For
Owner Type
Purchase Details
Closed on
Nov 13, 2018
Sold by
Kenny John J
Bought by
Pertuz Antonio J and Pertuz Sofia B
Current Estimated Value
Home Financials for this Owner
Home Financials are based on the most recent Mortgage that was taken out on this home.
Original Mortgage
$530,000
Outstanding Balance
$466,971
Interest Rate
4.9%
Mortgage Type
New Conventional
Estimated Equity
$326,946
Purchase Details
Closed on
Aug 13, 2002
Sold by
Kenny John
Purchase Details
Closed on
Mar 31, 2000
Sold by
Jones Karen
Bought by
Kenny John J
Purchase Details
Closed on
Nov 9, 1998
Create a Home Valuation Report for This Property
The Home Valuation Report is an in-depth analysis detailing your home's value as well as a comparison with similar homes in the area
Home Values in the Area
Average Home Value in this Area
Purchase History
| Date | Buyer | Sale Price | Title Company |
|---|---|---|---|
| Pertuz Antonio J | $560,000 | None Available | |
| -- | -- | -- | |
| Kenny John J | $180,000 | Louis Desena | |
| -- | -- | -- |
Source: Public Records
Mortgage History
| Date | Status | Borrower | Loan Amount |
|---|---|---|---|
| Open | Pertuz Antonio J | $530,000 |
Source: Public Records
Tax History Compared to Growth
Tax History
| Year | Tax Paid | Tax Assessment Tax Assessment Total Assessment is a certain percentage of the fair market value that is determined by local assessors to be the total taxable value of land and additions on the property. | Land | Improvement |
|---|---|---|---|---|
| 2025 | $13,256 | $465 | $204 | $261 |
| 2024 | $4,271 | $464 | $204 | $260 |
| 2023 | $13,072 | $480 | $211 | $269 |
| 2022 | $13,072 | $473 | $208 | $265 |
| 2021 | $17,505 | $466 | $205 | $261 |
| 2020 | $13,659 | $747 | $590 | $157 |
| 2019 | $4,206 | $747 | $516 | $231 |
| 2018 | $7,417 | $854 | $0 | $0 |
| 2017 | $7,724 | $854 | $590 | $264 |
| 2016 | $11,989 | $854 | $590 | $264 |
| 2015 | $3,977 | $854 | $590 | $264 |
| 2014 | $3,977 | $854 | $590 | $264 |
| 2013 | $3,724 | $854 | $590 | $264 |
Source: Public Records
Map
Nearby Homes