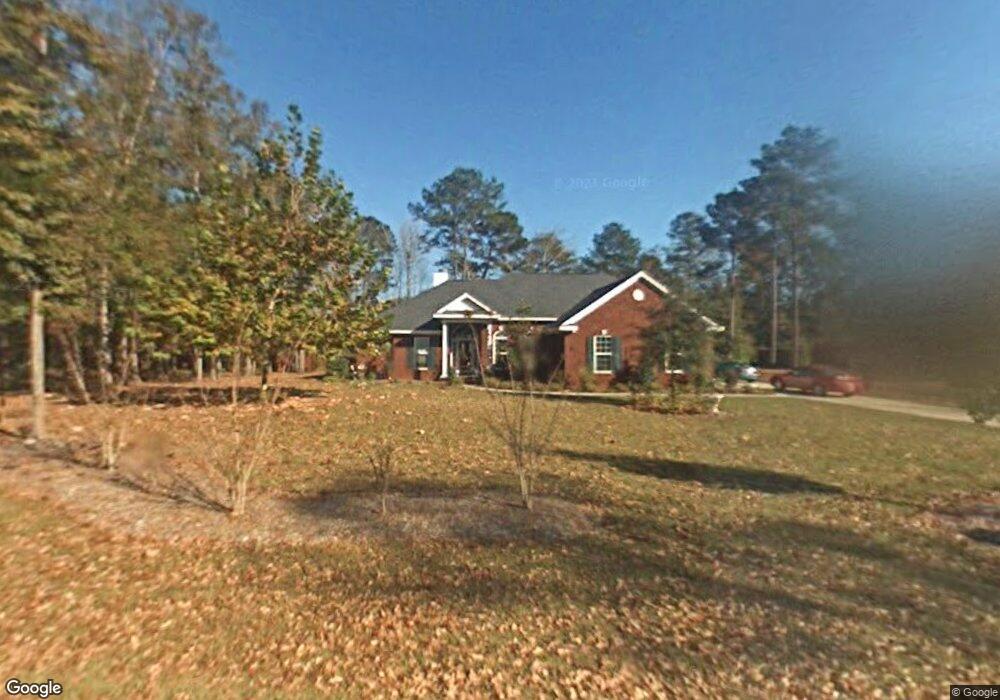
69 St Martins Cir Richmond Hill, GA 31324
Estimated Value: $462,000 - $534,000
4
Beds
3
Baths
2,556
Sq Ft
$195/Sq Ft
Est. Value
About This Home
This home is located at 69 St Martins Cir, Richmond Hill, GA 31324 and is currently estimated at $497,297, approximately $194 per square foot. 69 St Martins Cir is a home located in Bryan County with nearby schools including Dr. George Washington Carver Elementary School, Richmond Hill Elementary School, and Richmond Hill Middle School.
Ownership History
Date
Name
Owned For
Owner Type
Purchase Details
Closed on
Nov 25, 2017
Sold by
Nguyen Tina
Bought by
Nguyen Tina Thi Rev Liv Tr
Current Estimated Value
Purchase Details
Closed on
Apr 27, 2017
Sold by
Weleski Edward T
Bought by
Nguyen Tina
Purchase Details
Closed on
Jun 1, 2016
Bought by
Coleman Joshua Rex
Home Financials for this Owner
Home Financials are based on the most recent Mortgage that was taken out on this home.
Original Mortgage
$129,609
Interest Rate
3.64%
Purchase Details
Closed on
Jul 2, 2004
Sold by
Ernest Homes Llc
Bought by
Weleski Edward T and Weleski Nancy R
Purchase Details
Closed on
Jan 8, 2004
Sold by
Ernest Communities L
Bought by
Ernest Homes Llc
Purchase Details
Closed on
Jun 21, 2000
Bought by
Ernest Communities L
Create a Home Valuation Report for This Property
The Home Valuation Report is an in-depth analysis detailing your home's value as well as a comparison with similar homes in the area
Home Values in the Area
Average Home Value in this Area
Purchase History
| Date | Buyer | Sale Price | Title Company |
|---|---|---|---|
| Nguyen Tina Thi Rev Liv Tr | -- | -- | |
| Nguyen Tina | $277,000 | -- | |
| Coleman Joshua Rex | -- | -- | |
| Weleski Edward T | $244,800 | -- | |
| Ernest Homes Llc | $48,000 | -- | |
| Ernest Communities L | $400,000 | -- |
Source: Public Records
Mortgage History
| Date | Status | Borrower | Loan Amount |
|---|---|---|---|
| Previous Owner | Coleman Joshua Rex | $129,609 | |
| Previous Owner | Coleman Joshua Rex | -- |
Source: Public Records
Tax History Compared to Growth
Tax History
| Year | Tax Paid | Tax Assessment Tax Assessment Total Assessment is a certain percentage of the fair market value that is determined by local assessors to be the total taxable value of land and additions on the property. | Land | Improvement |
|---|---|---|---|---|
| 2024 | $4,281 | $169,400 | $32,000 | $137,400 |
| 2023 | $4,254 | $143,520 | $32,000 | $111,520 |
| 2022 | $3,787 | $141,400 | $32,000 | $109,400 |
| 2021 | $3,304 | $118,160 | $32,000 | $86,160 |
| 2020 | $2,941 | $118,160 | $32,000 | $86,160 |
| 2019 | $3,218 | $112,120 | $32,000 | $80,120 |
| 2018 | $3,126 | $110,120 | $30,000 | $80,120 |
| 2017 | $1,704 | $107,640 | $26,000 | $81,640 |
| 2016 | $2,610 | $106,160 | $26,000 | $80,160 |
| 2015 | $2,580 | $104,520 | $26,000 | $78,520 |
| 2014 | $2,629 | $106,280 | $26,000 | $80,280 |
Source: Public Records
Map
Nearby Homes
- 16 Old Martin Ln
- 15 Sabal Dr
- 89 Marsh Hen Ln
- 360 Beauly Dr
- 86 Brigham Dr
- 154 Sayle Ln
- 131 Brigham Dr
- 190 Sayle Ln
- 385 Timberland Cir
- 317 Mcgregor Cir
- 567 Foxtail Dr
- 139 Mingarry Dr
- 126 Carapace Ct
- 165 Tralee Ct
- 799 Brigham Dr
- 27 Dover Dr
- 99 Mcgregor Cir
- 446 Brigham Dr
- 271 Davis Rd
- 195 Cubbage Island Dr
- 69 Saint Martin Cir
- 49 Saint Martin Cir
- 97 Saint Martin Cir
- 39 Saint Martin Cir
- 90 Saint Martin Cir
- 125 St Martins Cir
- 125 St Martin Cir
- 125 Saint Martin Cir
- 19 Saint Martin Cir
- 118 Saint Martin Cir
- 338 St Martins Cir
- 412 St Martins Cir
- 145 Saint Martin Cir
- 338 Saint Martin Cir
- 412 Saint Martin Cir
- 180 Saint Martin Cir
- 411 Saint Martin Cir
- 53 Victors Ct
- 314 Saint Martin Cir
- 29 Victors Ct