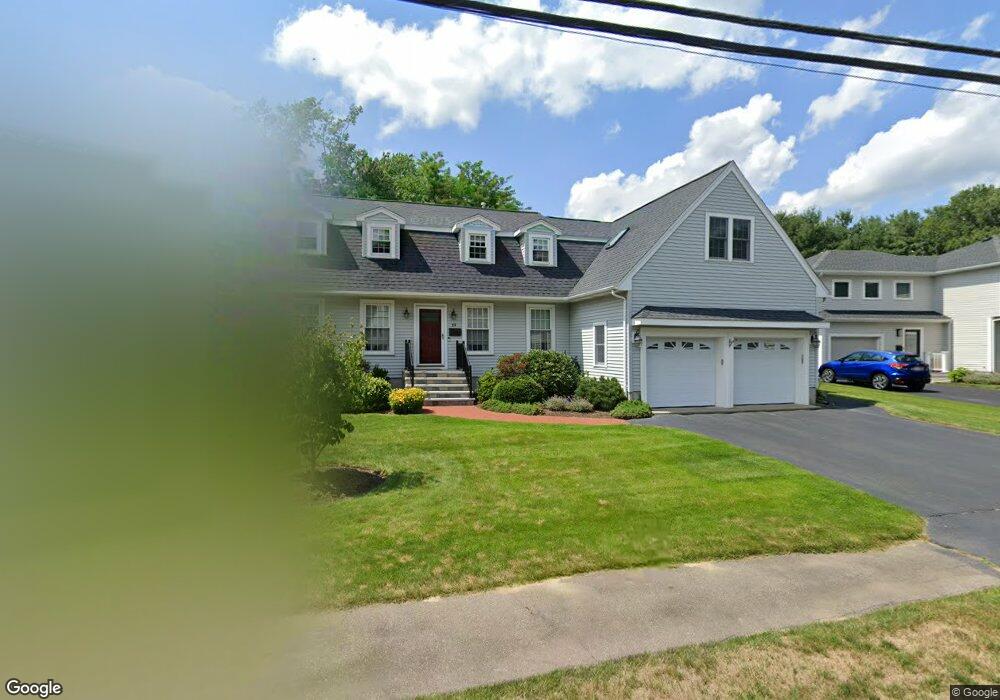
69 Standish Rd Needham, MA 02492
Estimated Value: $920,000 - $1,657,000
5
Beds
3
Baths
1,214
Sq Ft
$1,179/Sq Ft
Est. Value
About This Home
This home is located at 69 Standish Rd, Needham, MA 02492 and is currently estimated at $1,431,099, approximately $1,178 per square foot. 69 Standish Rd is a home located in Norfolk County with nearby schools including Newman Elementary School, High Rock Middle School, and Pollard Middle School.
Ownership History
Date
Name
Owned For
Owner Type
Purchase Details
Closed on
Apr 26, 2013
Sold by
Littman Robert N and Littman Bonnie H
Bought by
Standish Holiday Rt and Littman
Current Estimated Value
Purchase Details
Closed on
Jul 26, 1995
Sold by
Sugarman Nathan and Sugarman Esther G
Bought by
Littman Robert N
Create a Home Valuation Report for This Property
The Home Valuation Report is an in-depth analysis detailing your home's value as well as a comparison with similar homes in the area
Home Values in the Area
Average Home Value in this Area
Purchase History
| Date | Buyer | Sale Price | Title Company |
|---|---|---|---|
| Standish Holiday Rt | -- | -- | |
| Standish Holiday Rt | -- | -- | |
| Littman Robert N | $289,000 | -- | |
| Littman Robert N | $289,000 | -- |
Source: Public Records
Mortgage History
| Date | Status | Borrower | Loan Amount |
|---|---|---|---|
| Previous Owner | Littman Robert N | $158,000 | |
| Previous Owner | Littman Robert N | $251,000 |
Source: Public Records
Tax History
| Year | Tax Paid | Tax Assessment Tax Assessment Total Assessment is a certain percentage of the fair market value that is determined by local assessors to be the total taxable value of land and additions on the property. | Land | Improvement |
|---|---|---|---|---|
| 2025 | $14,846 | $1,400,600 | $795,700 | $604,900 |
| 2024 | $12,524 | $1,000,300 | $574,100 | $426,200 |
| 2023 | $12,564 | $963,500 | $574,100 | $389,400 |
| 2022 | $11,853 | $886,500 | $512,600 | $373,900 |
| 2021 | $11,551 | $886,500 | $512,600 | $373,900 |
| 2020 | $11,422 | $914,500 | $512,500 | $402,000 |
| 2019 | $10,641 | $858,800 | $465,900 | $392,900 |
| 2018 | $10,203 | $858,800 | $465,900 | $392,900 |
| 2017 | $9,656 | $812,100 | $465,900 | $346,200 |
| 2016 | $9,414 | $815,800 | $465,900 | $349,900 |
| 2015 | $9,210 | $815,800 | $465,900 | $349,900 |
| 2014 | $8,642 | $742,400 | $405,100 | $337,300 |
Source: Public Records
Map
Nearby Homes
- 37 Standish Rd
- 21 Brewster Dr
- 19 Mason Rd
- 15 Mackintosh Ave
- 333 Cartwright Rd
- 620 High Rock St
- 52 Hancock Rd
- 3 Hancock Rd
- 189 Bridle Trail Rd
- 102 Jarvis Cir Unit 102
- 170 Benvenue St
- 37 Carleton Dr
- 81 Parish Rd
- 36 Eliot Rd
- 15 Great Plain Ave
- 95 Deerfield Rd
- 15 Alden Rd
- 20 Arden Rd
- 34 Pershing Rd
- 222 Grove St
Your Personal Tour Guide
Ask me questions while you tour the home.