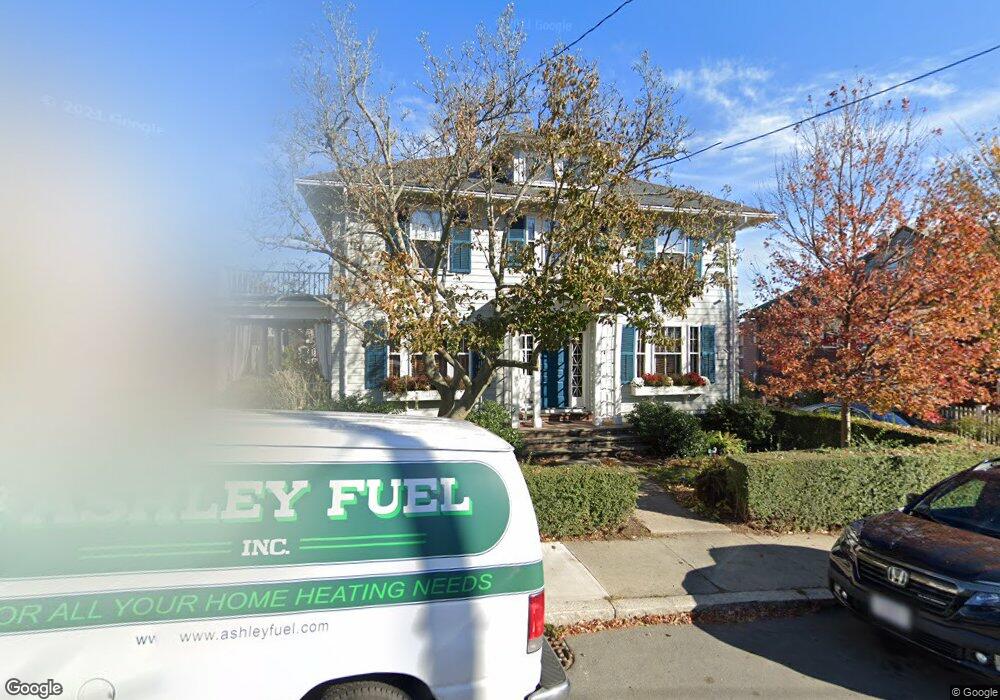
69 Summer St Salem, MA 01970
Downtown Salem NeighborhoodEstimated Value: $855,690 - $1,121,000
4
Beds
2
Baths
2,648
Sq Ft
$355/Sq Ft
Est. Value
About This Home
This home is located at 69 Summer St, Salem, MA 01970 and is currently estimated at $941,173, approximately $355 per square foot. 69 Summer St is a home located in Essex County with nearby schools including Saltonstall School, Carlton Elementary School, and Bates Elementary School.
Ownership History
Date
Name
Owned For
Owner Type
Purchase Details
Closed on
Feb 19, 2015
Sold by
Keck Anthony G and Stevens Mark A
Bought by
Keck Anthony G and Stevens Mark A
Current Estimated Value
Purchase Details
Closed on
Nov 1, 2001
Sold by
Wood Susan D
Bought by
Keck Anthony G and Stevens Mark A
Create a Home Valuation Report for This Property
The Home Valuation Report is an in-depth analysis detailing your home's value as well as a comparison with similar homes in the area
Home Values in the Area
Average Home Value in this Area
Purchase History
| Date | Buyer | Sale Price | Title Company |
|---|---|---|---|
| Keck Anthony G | -- | -- | |
| Keck Anthony G | $301,000 | -- |
Source: Public Records
Mortgage History
| Date | Status | Borrower | Loan Amount |
|---|---|---|---|
| Previous Owner | Keck Anthony G | $284,000 | |
| Previous Owner | Keck Anthony G | $100,000 |
Source: Public Records
Tax History Compared to Growth
Tax History
| Year | Tax Paid | Tax Assessment Tax Assessment Total Assessment is a certain percentage of the fair market value that is determined by local assessors to be the total taxable value of land and additions on the property. | Land | Improvement |
|---|---|---|---|---|
| 2025 | $8,833 | $778,900 | $229,800 | $549,100 |
| 2024 | $8,552 | $736,000 | $218,400 | $517,600 |
| 2023 | $8,312 | $664,400 | $201,600 | $462,800 |
| 2022 | $7,902 | $596,400 | $194,900 | $401,500 |
| 2021 | $7,807 | $565,700 | $181,400 | $384,300 |
| 2020 | $7,391 | $511,500 | $171,400 | $340,100 |
| 2019 | $7,367 | $487,900 | $162,600 | $325,300 |
| 2018 | $7,155 | $465,200 | $154,600 | $310,600 |
| 2017 | $6,728 | $424,200 | $130,400 | $293,800 |
| 2016 | $6,552 | $418,100 | $124,300 | $293,800 |
| 2015 | $6,260 | $381,500 | $114,200 | $267,300 |
Source: Public Records
Map
Nearby Homes
- 57 Endicott St Unit 2
- 11 Summer St
- 289 Essex St Unit 307
- 140 Washington St Unit 1C
- 304 Essex St Unit 1
- 38 Chestnut St
- 15 Lynde St Unit 26
- 288-292 Washington & 5 Porter St Ct
- 20 Central St Unit 402
- 47 Federal St
- 78 Federal St
- 9 Lyme St
- 35 Flint St Unit 209
- 35 Flint St Unit 106
- 39 1/2 Harbor St Unit 1
- 145 Federal St Unit 3
- 7 Fairfield St
- 22 Calabrese St
- 32 Park St
- 25 Calabrese St
- 71 Summer St
- 71 Summer St Unit 2
- 71 Summer St Unit 1
- 67 Summer St
- 65 Summer St
- 36 Endicott St Unit 2L
- 36 Endicott St Unit 3L
- 36 Endicott St Unit 3R
- 36 Endicott St
- 38 Endicott St
- 14 Pratt St
- 14 Pratt St Unit 2
- 14 Pratt St Unit 1
- 16 Pratt St Unit 3
- 16 Pratt St
- 73 Summer St
- 32 Endicott St
- 73 1/2 Summer St
- 73 1/2 Summer St Unit 2
- 68 Summer St