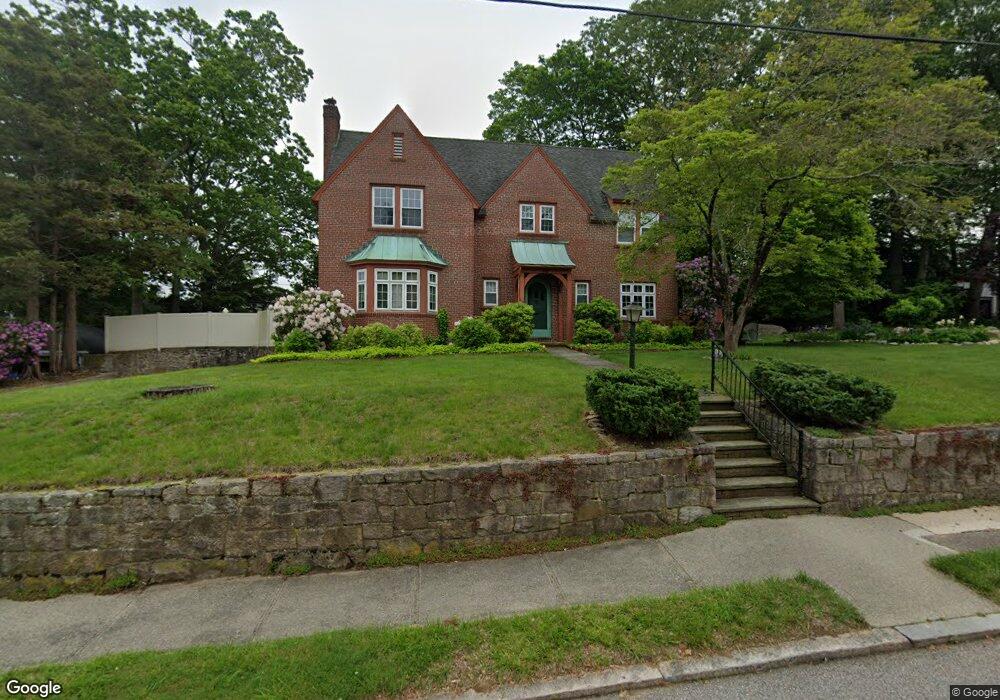
69 Summer St Westerly, RI 02891
Estimated Value: $677,000 - $942,000
4
Beds
3
Baths
2,362
Sq Ft
$322/Sq Ft
Est. Value
About This Home
This home is located at 69 Summer St, Westerly, RI 02891 and is currently estimated at $760,902, approximately $322 per square foot. 69 Summer St is a home located in Washington County with nearby schools including Westerly High School.
Ownership History
Date
Name
Owned For
Owner Type
Purchase Details
Closed on
Jul 22, 2013
Sold by
Beasley Glenn R
Bought by
Cheng Hong and Beasley Glenn R
Current Estimated Value
Purchase Details
Closed on
Nov 29, 1999
Sold by
Pignataro Richard L and Pignataro Constance C
Bought by
Beasley Glenn R
Create a Home Valuation Report for This Property
The Home Valuation Report is an in-depth analysis detailing your home's value as well as a comparison with similar homes in the area
Home Values in the Area
Average Home Value in this Area
Purchase History
| Date | Buyer | Sale Price | Title Company |
|---|---|---|---|
| Cheng Hong | -- | -- | |
| Cheng Hong | -- | -- | |
| Beasley Glenn R | $202,000 | -- |
Source: Public Records
Mortgage History
| Date | Status | Borrower | Loan Amount |
|---|---|---|---|
| Previous Owner | Beasley Glenn R | $147,828 | |
| Previous Owner | Beasley Glenn R | $133,600 | |
| Previous Owner | Beasley Glenn R | $14,000 | |
| Previous Owner | Beasley Glenn R | $11,000 |
Source: Public Records
Tax History Compared to Growth
Tax History
| Year | Tax Paid | Tax Assessment Tax Assessment Total Assessment is a certain percentage of the fair market value that is determined by local assessors to be the total taxable value of land and additions on the property. | Land | Improvement |
|---|---|---|---|---|
| 2025 | $4,829 | $620,700 | $199,200 | $421,500 |
| 2024 | $4,940 | $472,700 | $153,700 | $319,000 |
| 2023 | $4,803 | $472,700 | $153,700 | $319,000 |
| 2022 | $4,774 | $472,700 | $153,700 | $319,000 |
| 2021 | $4,859 | $402,900 | $138,800 | $264,100 |
| 2020 | $4,774 | $402,900 | $138,800 | $264,100 |
| 2019 | $4,730 | $402,900 | $138,800 | $264,100 |
| 2018 | $4,641 | $375,800 | $138,800 | $237,000 |
| 2017 | $4,510 | $375,800 | $138,800 | $237,000 |
| 2016 | $4,510 | $375,800 | $138,800 | $237,000 |
| 2015 | $4,294 | $382,400 | $140,800 | $241,600 |
| 2014 | $4,226 | $382,400 | $140,800 | $241,600 |
Source: Public Records
Map
Nearby Homes
- 52 Spruce St
- 38 Newton Ave
- 145 High St Unit D
- 9 Ward Ave
- 140 High St Unit 307
- 19 Pleasant St
- 57 School St
- 6 Tidewinds Ln
- 25 School St Unit 4
- 25 School St Unit 2
- 4 Pearl St
- 24 George St
- 67 Cross St
- 223 High St Unit S
- 44 George St
- 22 Colonial Dr
- 77 Mechanic St
- 0 Iroquois Ave
- 29 John St
- 6 Boiling Spring Ave