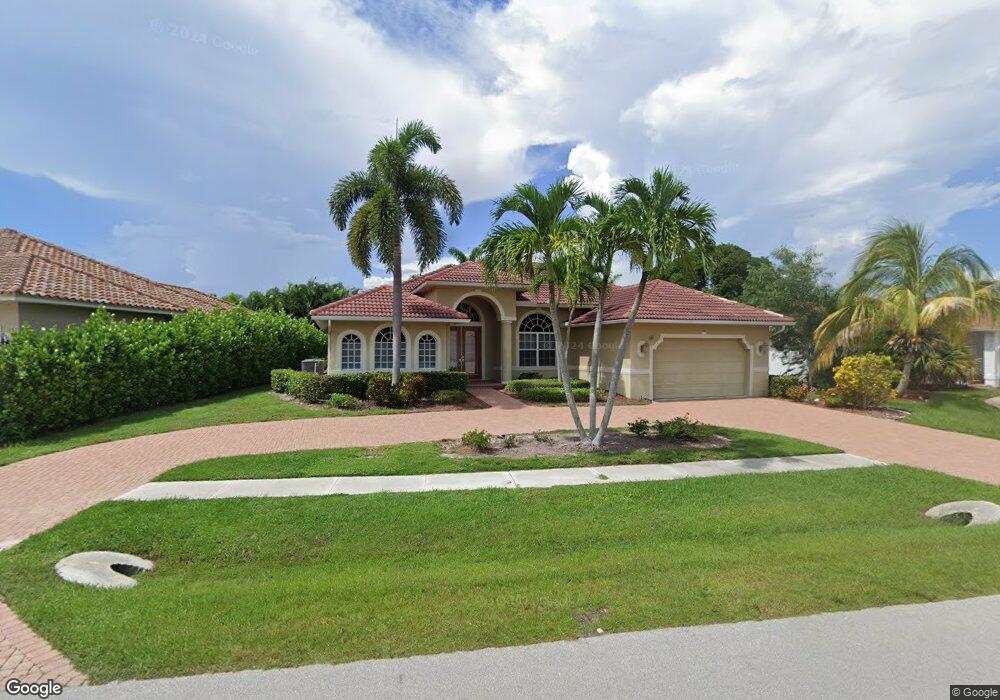
69 Tahiti Rd Marco Island, FL 34145
Estimated Value: $809,642 - $1,086,000
3
Beds
2
Baths
1,911
Sq Ft
$487/Sq Ft
Est. Value
About This Home
This home is located at 69 Tahiti Rd, Marco Island, FL 34145 and is currently estimated at $931,161, approximately $487 per square foot. 69 Tahiti Rd is a home located in Collier County with nearby schools including Tommie Barfield Elementary School, Manatee Middle School, and Lely High School.
Ownership History
Date
Name
Owned For
Owner Type
Purchase Details
Closed on
Jan 24, 2006
Sold by
Randazzo Giuseppe and Randazzo Stella
Bought by
Randazzo Maria Stella
Current Estimated Value
Purchase Details
Closed on
May 25, 2004
Sold by
Bubri Leonard J
Bought by
Randazzo Giuseppe and Randazzo Stella
Purchase Details
Closed on
Jan 23, 2002
Sold by
Pelensky Mark
Bought by
Bubri Leonard J
Home Financials for this Owner
Home Financials are based on the most recent Mortgage that was taken out on this home.
Original Mortgage
$54,661
Interest Rate
7.08%
Purchase Details
Closed on
Jul 21, 2000
Sold by
Lomazzo Joseph S and Lomazzo Clara
Bought by
Pelensky Mark
Purchase Details
Closed on
May 14, 1997
Sold by
Gonzalez Jose
Bought by
Lomazzo Joseph S and Lomazzo Clara
Create a Home Valuation Report for This Property
The Home Valuation Report is an in-depth analysis detailing your home's value as well as a comparison with similar homes in the area
Home Values in the Area
Average Home Value in this Area
Purchase History
| Date | Buyer | Sale Price | Title Company |
|---|---|---|---|
| Randazzo Maria Stella | -- | None Available | |
| Randazzo Giuseppe | $428,500 | -- | |
| Bubri Leonard J | $76,300 | -- | |
| Pelensky Mark | $45,000 | -- | |
| Lomazzo Joseph S | $27,500 | -- |
Source: Public Records
Mortgage History
| Date | Status | Borrower | Loan Amount |
|---|---|---|---|
| Previous Owner | Bubri Leonard J | $54,661 |
Source: Public Records
Tax History Compared to Growth
Tax History
| Year | Tax Paid | Tax Assessment Tax Assessment Total Assessment is a certain percentage of the fair market value that is determined by local assessors to be the total taxable value of land and additions on the property. | Land | Improvement |
|---|---|---|---|---|
| 2025 | $5,848 | $665,755 | -- | -- |
| 2024 | $6,441 | $605,232 | -- | -- |
| 2023 | $6,441 | $550,211 | $0 | $0 |
| 2022 | $6,186 | $500,192 | $0 | $0 |
| 2021 | $5,146 | $454,720 | $88,178 | $366,542 |
| 2020 | $5,057 | $446,816 | $0 | $0 |
| 2019 | $4,672 | $406,196 | $113,185 | $293,011 |
| 2018 | $4,799 | $417,157 | $96,755 | $320,402 |
| 2017 | $4,884 | $420,080 | $90,183 | $329,897 |
| 2016 | $4,697 | $395,262 | $0 | $0 |
| 2015 | $4,356 | $359,329 | $0 | $0 |
| 2014 | $4,043 | $329,020 | $0 | $0 |
Source: Public Records
Map
Nearby Homes