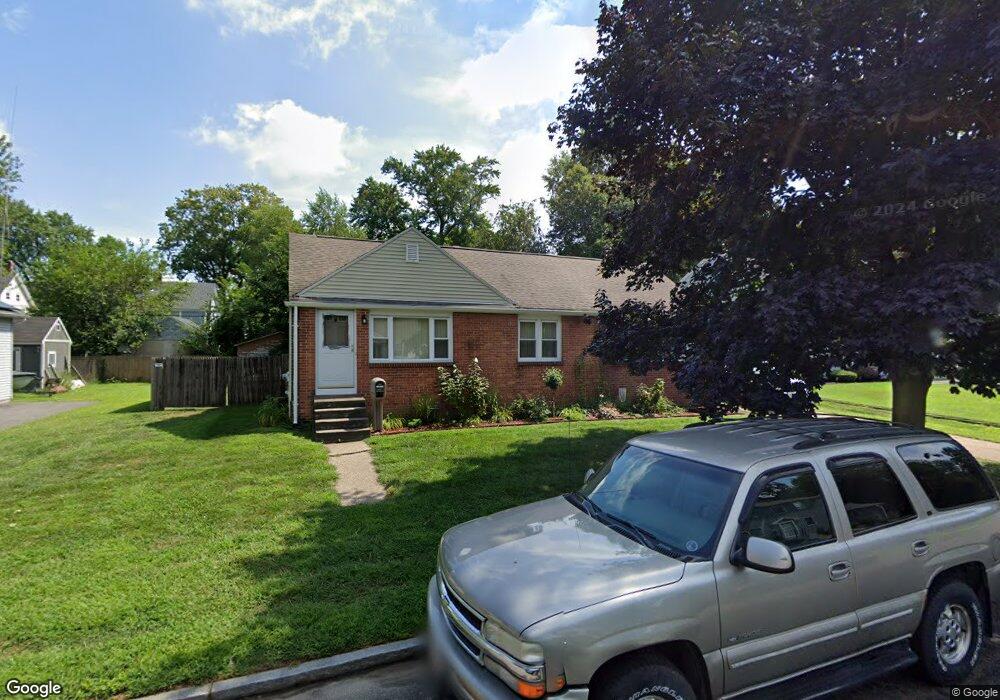
69 Thorndyke St Springfield, MA 01118
East Forest Park NeighborhoodEstimated Value: $232,000 - $311,000
2
Beds
1
Bath
1,104
Sq Ft
$253/Sq Ft
Est. Value
About This Home
This home is located at 69 Thorndyke St, Springfield, MA 01118 and is currently estimated at $279,002, approximately $252 per square foot. 69 Thorndyke St is a home located in Hampden County with nearby schools including Frederick Harris Elementary School, M Marcus Kiley Middle, and High School Of Commerce.
Ownership History
Date
Name
Owned For
Owner Type
Purchase Details
Closed on
Sep 29, 2021
Sold by
Brown Sharen L
Bought by
Kavanagh Sharen L and Kavanagh Kevin P
Current Estimated Value
Purchase Details
Closed on
Jan 28, 1983
Bought by
Brown Sharen L
Create a Home Valuation Report for This Property
The Home Valuation Report is an in-depth analysis detailing your home's value as well as a comparison with similar homes in the area
Home Values in the Area
Average Home Value in this Area
Purchase History
| Date | Buyer | Sale Price | Title Company |
|---|---|---|---|
| Kavanagh Sharen L | -- | None Available | |
| Brown Sharen L | $39,900 | -- |
Source: Public Records
Mortgage History
| Date | Status | Borrower | Loan Amount |
|---|---|---|---|
| Previous Owner | Brown Sharen L | $60,000 | |
| Previous Owner | Brown Sharen L | $25,000 | |
| Previous Owner | Brown Sharen L | $35,000 |
Source: Public Records
Tax History Compared to Growth
Tax History
| Year | Tax Paid | Tax Assessment Tax Assessment Total Assessment is a certain percentage of the fair market value that is determined by local assessors to be the total taxable value of land and additions on the property. | Land | Improvement |
|---|---|---|---|---|
| 2025 | $3,456 | $220,400 | $38,600 | $181,800 |
| 2024 | $3,443 | $214,400 | $38,600 | $175,800 |
| 2023 | $3,211 | $188,300 | $36,800 | $151,500 |
| 2022 | $3,085 | $163,900 | $36,800 | $127,100 |
| 2021 | $2,928 | $154,900 | $33,500 | $121,400 |
| 2020 | $2,805 | $143,600 | $33,500 | $110,100 |
| 2019 | $2,649 | $134,600 | $33,500 | $101,100 |
| 2018 | $2,606 | $132,400 | $33,500 | $98,900 |
| 2017 | $2,450 | $124,600 | $31,900 | $92,700 |
| 2016 | $2,412 | $122,700 | $31,900 | $90,800 |
| 2015 | $2,014 | $102,400 | $31,900 | $70,500 |
Source: Public Records
Map
Nearby Homes
- 10 Brunswick St
- 24 Bangor St
- 6 Eton St
- 615 White St
- 12 Prescott St
- 19 Roosevelt Ave
- 914-916 Belmont Ave
- 910-912 Belmont Ave
- 58 Gilman St
- 40 Rittenhouse Terrace
- 52 Luden St
- 134 Eddywood St
- 41-43 Whittier St
- 20 Taft St
- 26 Dwight Rd
- 28 Juliet St
- 54 Ellsworth Ave
- 86 Belvidere St
- 32 Dorset St
- 33 Taber St
- 57 Thorndyke St
- 75 Thorndyke St
- 68 Castle St
- 64 Castle St
- 80 Castle St
- 78 Thorndyke St
- 58 Castle St
- 68 Thorndyke St
- 53 Thorndyke St
- 86 Castle St
- 58 Thorndyke St
- 52 Castle St Unit 54
- 79 Castle St
- 47 Thorndyke St
- 54 Thorndyke St
- 48 Castle St
- 61 Spencer St
- 61 Spencer St Unit 1
- 67 Castle St
- 73 Castle St