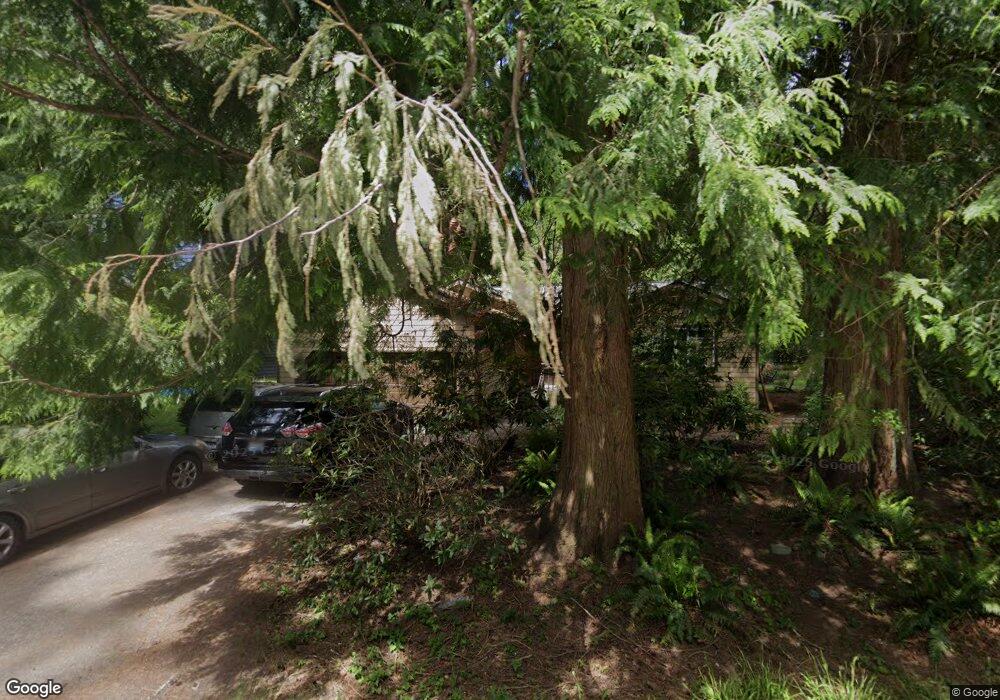
69 Valley Crest Way Bellingham, WA 98229
Estimated Value: $446,000 - $532,000
3
Beds
2
Baths
1,232
Sq Ft
$387/Sq Ft
Est. Value
About This Home
This home is located at 69 Valley Crest Way, Bellingham, WA 98229 and is currently estimated at $477,199, approximately $387 per square foot. 69 Valley Crest Way is a home located in Whatcom County with nearby schools including Geneva Elementary School, Kulshan Middle School, and Bellingham High School.
Ownership History
Date
Name
Owned For
Owner Type
Purchase Details
Closed on
Mar 8, 2021
Sold by
Armstrong David J and Armstrong Theresa L
Bought by
Ellis Wayne R and Porter Jeffery B
Current Estimated Value
Home Financials for this Owner
Home Financials are based on the most recent Mortgage that was taken out on this home.
Original Mortgage
$251,300
Outstanding Balance
$225,653
Interest Rate
2.8%
Mortgage Type
New Conventional
Estimated Equity
$251,546
Purchase Details
Closed on
Mar 6, 2021
Sold by
Armstrong David J and Armstrong Theresa L
Bought by
Porter Jeffery B and Porter Megen A
Home Financials for this Owner
Home Financials are based on the most recent Mortgage that was taken out on this home.
Original Mortgage
$251,300
Outstanding Balance
$225,653
Interest Rate
2.8%
Mortgage Type
New Conventional
Estimated Equity
$251,546
Purchase Details
Closed on
Oct 13, 2009
Sold by
Vanburen Taimi R
Bought by
Armstrong David J and Armstrong Theresa L
Home Financials for this Owner
Home Financials are based on the most recent Mortgage that was taken out on this home.
Original Mortgage
$195,886
Interest Rate
5.02%
Mortgage Type
FHA
Create a Home Valuation Report for This Property
The Home Valuation Report is an in-depth analysis detailing your home's value as well as a comparison with similar homes in the area
Home Values in the Area
Average Home Value in this Area
Purchase History
| Date | Buyer | Sale Price | Title Company |
|---|---|---|---|
| Ellis Wayne R | $359,000 | Chicago Title | |
| Porter Jeffery B | $359,000 | Chicago Title Bellingham | |
| Armstrong David J | $199,780 | Whatcom Land Title |
Source: Public Records
Mortgage History
| Date | Status | Borrower | Loan Amount |
|---|---|---|---|
| Open | Ellis Wayne R | $251,300 | |
| Closed | Porter Jeffery B | $251,300 | |
| Previous Owner | Armstrong David J | $195,886 |
Source: Public Records
Tax History Compared to Growth
Tax History
| Year | Tax Paid | Tax Assessment Tax Assessment Total Assessment is a certain percentage of the fair market value that is determined by local assessors to be the total taxable value of land and additions on the property. | Land | Improvement |
|---|---|---|---|---|
| 2024 | $3,461 | $392,987 | $134,920 | $258,067 |
| 2023 | $3,461 | $395,387 | $135,744 | $259,643 |
| 2022 | $2,768 | $340,860 | $117,024 | $223,836 |
| 2021 | $2,654 | $247,000 | $84,800 | $162,200 |
| 2020 | $2,594 | $233,019 | $80,000 | $153,019 |
| 2019 | $2,359 | $227,178 | $69,044 | $158,134 |
| 2018 | $2,366 | $213,300 | $64,800 | $148,500 |
| 2017 | $1,999 | $182,273 | $55,350 | $126,923 |
| 2016 | $1,794 | $160,327 | $48,600 | $111,727 |
| 2015 | $1,797 | $150,604 | $46,323 | $104,281 |
| 2014 | -- | $146,303 | $45,000 | $101,303 |
| 2013 | -- | $136,921 | $42,600 | $94,321 |
Source: Public Records
Map
Nearby Homes
- 63 Valley Crest Way
- 43 Rocky Ridge Dr
- 422 Sudden Valley Dr
- 19 Valley Crest Way
- 3 Acorn Place
- 434 Sudden Valley Dr
- 1 Valley Crest Way
- 337 Sudden Valley Dr
- 15 Wintercress Way
- 21 Clematis Ln
- 2 Marigold Dr Unit 26
- 2 Marigold Dr Unit 36
- 76B Sudden Valley Dr
- 8 Morning Glory Dr
- 36 Holly View Way
- 5 Shetland Ct
- 63 Louise View Dr
- 8 Shetland Ct
- 22 Shetland Ct
- 7 Deer Run Ln
- 47 Valley Crest Way
- 71 Valley Crest Way
- 67 Valley Crest Way
- 56 Valley Crest Way
- 65 Valley Crest Way
- 52 Valley Crest Way
- 73 Valley Crest Way
- 54 Valley Crest Way
- 58 Valley Crest Way
- 50 Valley Crest Way
- 75 Valley Crest Way
- 3 Eagle Crest Ct
- 31 Rocky Ridge Dr
- 51 Valley Crest Way
- 46 Valley Crest Way
- 62 Valley Crest Way
- 11 Eagle Crest Ct
- 33 Rocky Ridge Dr
- 34 Rocky Ridge Dr
- 6 Eagle Crest Ct