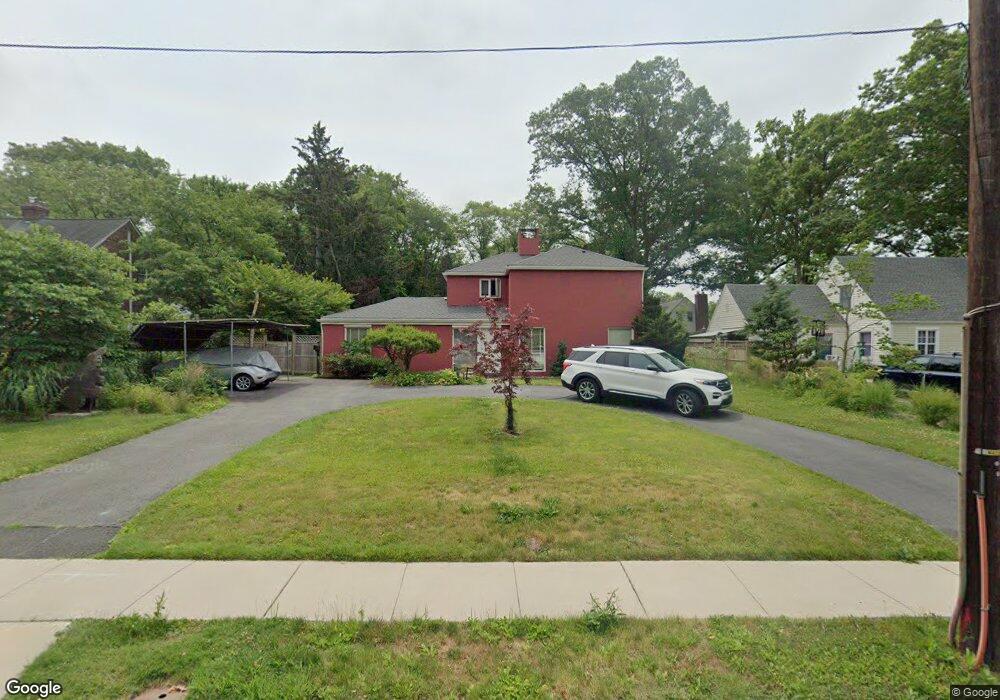
69 Valley Rd Princeton, NJ 08540
Estimated Value: $1,107,314 - $1,301,000
--
Bed
--
Bath
2,282
Sq Ft
$523/Sq Ft
Est. Value
About This Home
This home is located at 69 Valley Rd, Princeton, NJ 08540 and is currently estimated at $1,192,829, approximately $522 per square foot. 69 Valley Rd is a home located in Mercer County with nearby schools including Community Park Elementary School, Princeton Middle School, and Princeton High School.
Ownership History
Date
Name
Owned For
Owner Type
Purchase Details
Closed on
Mar 19, 2021
Sold by
Borneman John W
Bought by
Borneman John W and Ghassem Fachandi Parvis
Current Estimated Value
Home Financials for this Owner
Home Financials are based on the most recent Mortgage that was taken out on this home.
Original Mortgage
$267,000
Interest Rate
2.8%
Mortgage Type
New Conventional
Purchase Details
Closed on
May 3, 2004
Sold by
Maurer Sherry
Bought by
Borneman John
Home Financials for this Owner
Home Financials are based on the most recent Mortgage that was taken out on this home.
Original Mortgage
$329,800
Interest Rate
6.25%
Purchase Details
Closed on
Apr 1, 1999
Sold by
Faughnan Brian
Bought by
Maclean Sherry and Maurer Kurt
Home Financials for this Owner
Home Financials are based on the most recent Mortgage that was taken out on this home.
Original Mortgage
$240,000
Interest Rate
7.02%
Create a Home Valuation Report for This Property
The Home Valuation Report is an in-depth analysis detailing your home's value as well as a comparison with similar homes in the area
Home Values in the Area
Average Home Value in this Area
Purchase History
| Date | Buyer | Sale Price | Title Company |
|---|---|---|---|
| Borneman John W | -- | Accommodation | |
| Borneman John W | -- | New Title Company Name | |
| Borneman John | $582,000 | -- | |
| Maclean Sherry | $300,000 | -- |
Source: Public Records
Mortgage History
| Date | Status | Borrower | Loan Amount |
|---|---|---|---|
| Previous Owner | Borneman John W | $267,000 | |
| Previous Owner | Borneman John | $329,800 | |
| Previous Owner | Maclean Sherry | $240,000 |
Source: Public Records
Tax History Compared to Growth
Tax History
| Year | Tax Paid | Tax Assessment Tax Assessment Total Assessment is a certain percentage of the fair market value that is determined by local assessors to be the total taxable value of land and additions on the property. | Land | Improvement |
|---|---|---|---|---|
| 2025 | $14,947 | $561,300 | $333,000 | $228,300 |
| 2024 | $14,111 | $561,300 | $333,000 | $228,300 |
| 2023 | $14,111 | $561,300 | $333,000 | $228,300 |
| 2022 | $13,485 | $554,500 | $333,000 | $221,500 |
| 2021 | $13,524 | $554,500 | $333,000 | $221,500 |
| 2020 | $13,419 | $554,500 | $333,000 | $221,500 |
| 2019 | $13,153 | $554,500 | $333,000 | $221,500 |
| 2018 | $12,931 | $554,500 | $333,000 | $221,500 |
| 2017 | $12,754 | $554,500 | $333,000 | $221,500 |
| 2016 | $11,827 | $522,400 | $318,000 | $204,400 |
| 2015 | $11,555 | $522,400 | $318,000 | $204,400 |
| 2014 | $11,414 | $522,400 | $318,000 | $204,400 |
Source: Public Records
Map
Nearby Homes