Estimated Value: $301,000 - $374,000
2
Beds
2
Baths
2,784
Sq Ft
$121/Sq Ft
Est. Value
About This Home
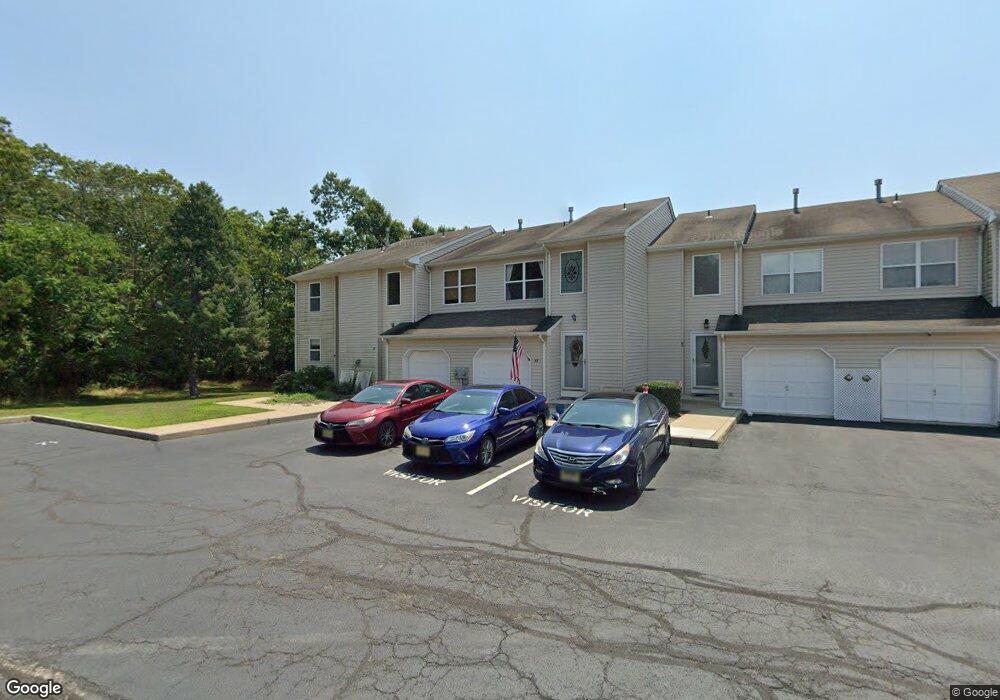
This home is located at 69 Vincent Ct, Little Egg Harbor Township, NJ 08087 and is currently estimated at $335,568, approximately $120 per square foot. 69 Vincent Ct is a home located in Ocean County with nearby schools including Frog Pond Elementary School, Pinelands Regional Junior High School, and Pinelands Regional High School.
Ownership History
Date
Name
Owned For
Owner Type
Purchase Details
Closed on
Mar 17, 2023
Sold by
Rosamilia Anthony
Bought by
Chapman Jennifer
Current Estimated Value
Purchase Details
Closed on
Apr 25, 2022
Sold by
Mazzatelli Alison
Bought by
Rosamilia Anthony
Purchase Details
Closed on
Feb 28, 2006
Sold by
Karozichian Barkevh Parki and Karozichian Hasmik
Bought by
Barbito Alison
Home Financials for this Owner
Home Financials are based on the most recent Mortgage that was taken out on this home.
Original Mortgage
$168,000
Interest Rate
6.15%
Mortgage Type
Fannie Mae Freddie Mac
Purchase Details
Closed on
Jul 16, 2002
Sold by
Little Egg Harbor Estates
Bought by
Karozichian Barkevh Parki and Karozichian Nasnik
Create a Home Valuation Report for This Property
The Home Valuation Report is an in-depth analysis detailing your home's value as well as a comparison with similar homes in the area
Home Values in the Area
Average Home Value in this Area
Purchase History
| Date | Buyer | Sale Price | Title Company |
|---|---|---|---|
| Chapman Jennifer | $240,000 | First American Title | |
| Chapman Jennifer | $240,000 | First American Title | |
| Rosamilia Anthony | $170,000 | Foundation Title | |
| Rosamilia Anthony | $170,000 | Foundation Title | |
| Barbito Alison | $210,000 | None Available | |
| Karozichian Barkevh Parki | $109,900 | -- |
Source: Public Records
Mortgage History
| Date | Status | Borrower | Loan Amount |
|---|---|---|---|
| Previous Owner | Barbito Alison | $168,000 | |
| Previous Owner | Barbito Alison | $31,500 |
Source: Public Records
Tax History Compared to Growth
Tax History
| Year | Tax Paid | Tax Assessment Tax Assessment Total Assessment is a certain percentage of the fair market value that is determined by local assessors to be the total taxable value of land and additions on the property. | Land | Improvement |
|---|---|---|---|---|
| 2025 | $4,513 | $152,300 | $19,300 | $133,000 |
| 2024 | $3,938 | $152,300 | $19,300 | $133,000 |
| 2023 | $3,814 | $138,700 | $19,300 | $119,400 |
| 2022 | $3,814 | $138,700 | $19,300 | $119,400 |
| 2021 | $3,724 | $138,700 | $19,300 | $119,400 |
| 2020 | $3,676 | $138,700 | $19,300 | $119,400 |
| 2019 | $3,527 | $138,700 | $19,300 | $119,400 |
| 2018 | $3,326 | $138,700 | $19,300 | $119,400 |
| 2017 | $3,275 | $138,700 | $19,300 | $119,400 |
| 2016 | $3,301 | $138,700 | $19,300 | $119,400 |
| 2015 | $3,341 | $138,700 | $19,300 | $119,400 |
| 2014 | $3,316 | $173,500 | $40,000 | $133,500 |
Source: Public Records
Map
Nearby Homes