Estimated Value: $167,000 - $214,000
3
Beds
2
Baths
2,212
Sq Ft
$87/Sq Ft
Est. Value
About This Home
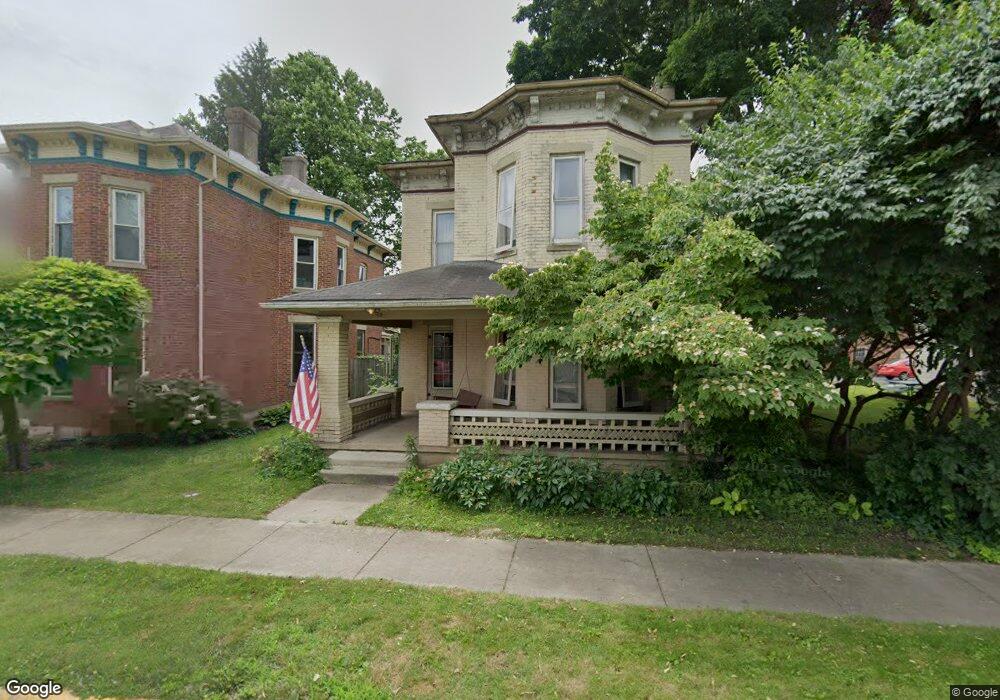
This home is located at 69 W 3rd St, Xenia, OH 45385 and is currently estimated at $191,407, approximately $86 per square foot. 69 W 3rd St is a home located in Greene County with nearby schools including Xenia High School, Summit Academy Community School for Alternative Learners - Xenia, and Legacy Christian Academy.
Ownership History
Date
Name
Owned For
Owner Type
Purchase Details
Closed on
Aug 24, 2004
Sold by
Ferguson Jennifer S
Bought by
Ferguson Lance S
Current Estimated Value
Purchase Details
Closed on
Jan 31, 2001
Sold by
Fox Kevin and Fox Keeli
Bought by
Ferguson Lance S and Ferguson Jennifer S
Home Financials for this Owner
Home Financials are based on the most recent Mortgage that was taken out on this home.
Original Mortgage
$127,350
Interest Rate
7.18%
Mortgage Type
VA
Create a Home Valuation Report for This Property
The Home Valuation Report is an in-depth analysis detailing your home's value as well as a comparison with similar homes in the area
Home Values in the Area
Average Home Value in this Area
Purchase History
| Date | Buyer | Sale Price | Title Company |
|---|---|---|---|
| Ferguson Lance S | -- | -- | |
| Ferguson Lance S | $124,900 | -- |
Source: Public Records
Mortgage History
| Date | Status | Borrower | Loan Amount |
|---|---|---|---|
| Closed | Ferguson Lance S | $127,350 |
Source: Public Records
Tax History Compared to Growth
Tax History
| Year | Tax Paid | Tax Assessment Tax Assessment Total Assessment is a certain percentage of the fair market value that is determined by local assessors to be the total taxable value of land and additions on the property. | Land | Improvement |
|---|---|---|---|---|
| 2024 | $1,994 | $46,590 | $2,170 | $44,420 |
| 2023 | $1,994 | $46,590 | $2,170 | $44,420 |
| 2022 | $1,753 | $34,940 | $1,740 | $33,200 |
| 2021 | $1,776 | $34,940 | $1,740 | $33,200 |
| 2020 | $1,702 | $34,940 | $1,740 | $33,200 |
| 2019 | $1,286 | $24,860 | $1,520 | $23,340 |
| 2018 | $1,291 | $24,860 | $1,520 | $23,340 |
| 2017 | $1,314 | $24,860 | $1,520 | $23,340 |
| 2016 | $1,314 | $24,830 | $1,520 | $23,310 |
| 2015 | $1,318 | $24,830 | $1,520 | $23,310 |
| 2014 | $1,262 | $24,830 | $1,520 | $23,310 |
Source: Public Records
Map
Nearby Homes