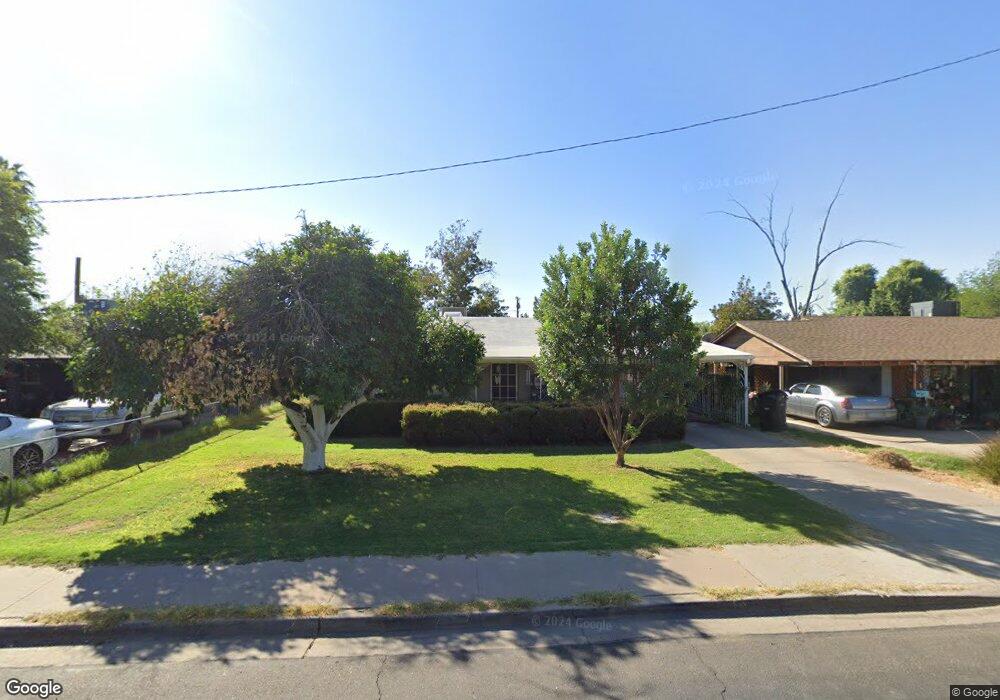
69 W Harrison St Chandler, AZ 85225
Arrowhead Meadows NeighborhoodEstimated Value: $310,072 - $399,000
--
Bed
1
Bath
972
Sq Ft
$360/Sq Ft
Est. Value
About This Home
This home is located at 69 W Harrison St, Chandler, AZ 85225 and is currently estimated at $349,768, approximately $359 per square foot. 69 W Harrison St is a home located in Maricopa County with nearby schools including Hartford Sylvia Encinas Elementary School, Chandler High School, and Andersen Junior High School.
Ownership History
Date
Name
Owned For
Owner Type
Purchase Details
Closed on
May 7, 2015
Sold by
Miller Keith Wade and Miller Sabine Ingrid
Bought by
Miller Sabine Ingrid and Miller Keith Wade
Current Estimated Value
Purchase Details
Closed on
Jul 15, 2004
Sold by
Miller Sabine Ingrid and Miller Keith Wade
Bought by
Miller Keith Wade and Miller Sabine Ingrid
Home Financials for this Owner
Home Financials are based on the most recent Mortgage that was taken out on this home.
Original Mortgage
$85,000
Outstanding Balance
$42,603
Interest Rate
6.27%
Mortgage Type
New Conventional
Estimated Equity
$307,165
Purchase Details
Closed on
Nov 23, 1994
Sold by
Herring Gracia D
Bought by
Baldenegro Sabine Ingrid and Baldenegro Hannelore M
Home Financials for this Owner
Home Financials are based on the most recent Mortgage that was taken out on this home.
Original Mortgage
$57,566
Interest Rate
8.44%
Mortgage Type
FHA
Create a Home Valuation Report for This Property
The Home Valuation Report is an in-depth analysis detailing your home's value as well as a comparison with similar homes in the area
Home Values in the Area
Average Home Value in this Area
Purchase History
| Date | Buyer | Sale Price | Title Company |
|---|---|---|---|
| Miller Sabine Ingrid | -- | None Available | |
| Miller Keith Wade | -- | -- | |
| Baldenegro Sabine Ingrid | $57,500 | United Title Agency |
Source: Public Records
Mortgage History
| Date | Status | Borrower | Loan Amount |
|---|---|---|---|
| Open | Miller Keith Wade | $85,000 | |
| Previous Owner | Baldenegro Sabine Ingrid | $57,566 |
Source: Public Records
Tax History Compared to Growth
Tax History
| Year | Tax Paid | Tax Assessment Tax Assessment Total Assessment is a certain percentage of the fair market value that is determined by local assessors to be the total taxable value of land and additions on the property. | Land | Improvement |
|---|---|---|---|---|
| 2025 | $555 | $7,124 | -- | -- |
| 2024 | $536 | $6,784 | -- | -- |
| 2023 | $536 | $26,780 | $5,350 | $21,430 |
| 2022 | $517 | $18,750 | $3,750 | $15,000 |
| 2021 | $542 | $18,050 | $3,610 | $14,440 |
| 2020 | $540 | $15,380 | $3,070 | $12,310 |
| 2019 | $519 | $13,070 | $2,610 | $10,460 |
| 2018 | $503 | $12,130 | $2,420 | $9,710 |
| 2017 | $468 | $11,150 | $2,230 | $8,920 |
| 2016 | $451 | $9,730 | $1,940 | $7,790 |
| 2015 | $437 | $9,300 | $1,860 | $7,440 |
Source: Public Records
Map
Nearby Homes
- 101 W Harrison St
- 762 N Washington St
- 121 W Galveston St
- 200 E Ivanhoe St Unit 60
- 380 W Shannon St
- 721 N Delaware St
- 501 W Dublin St
- 501 N Delaware St
- 1100 N California St
- 640 W Laredo St
- 651 W Laredo St
- 501 E Ray Rd Unit 201
- 501 E Ray Rd Unit 230
- 501 E Ray Rd Unit 36
- 645 N Vine St
- 635 N Vine St
- 670 W Laredo St
- 625 N Vine St
- 161 E Erie St
- 644 N Vine St
- 79 W Harrison St
- 59 W Harrison St
- 49 W Harrison St
- 89 W Harrison St
- 99 W Harrison St
- 68 W Harrison St
- 78 W Harrison St
- 58 W Harrison St
- 88 W Harrison St
- 48 W Harrison St
- 98 W Harrison St
- 38 W Harrison St
- 100 W Harrison St
- 28 W Harrison St
- 109 W Harrison St
- 9 W Harrison St Unit 4
- 9 W Harrison St Unit 1
- 9 W Harrison St
- 118 W Harrison St
- 119 W Harrison St