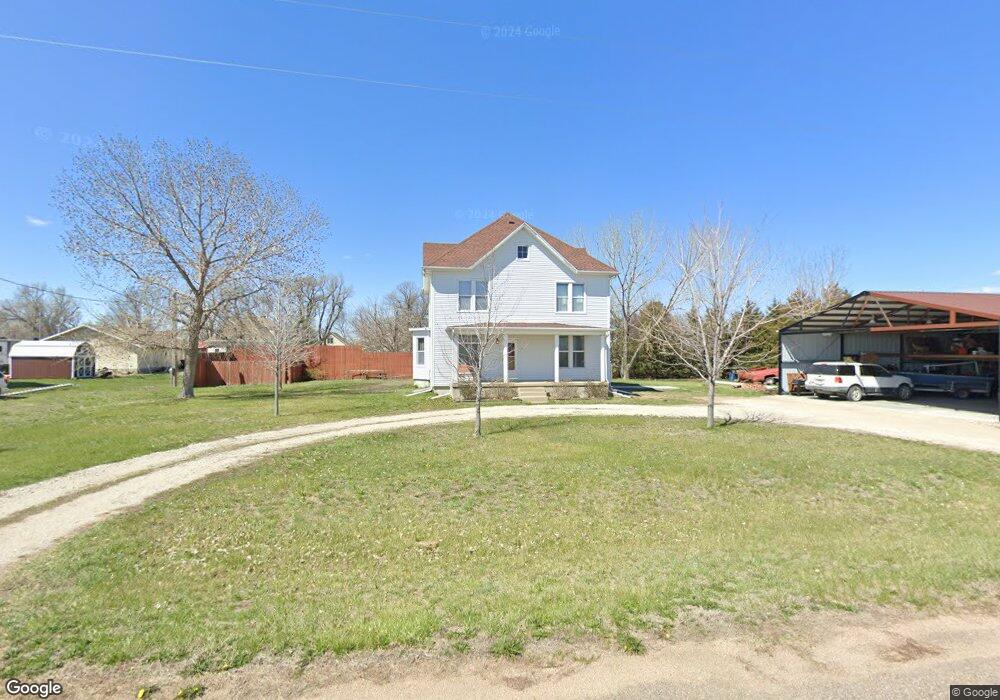
69 Wallace St Trumbull, NE 68980
Estimated Value: $145,000 - $753,000
4
Beds
1
Bath
2,160
Sq Ft
$156/Sq Ft
Est. Value
About This Home
This home is located at 69 Wallace St, Trumbull, NE 68980 and is currently estimated at $336,840, approximately $155 per square foot. 69 Wallace St is a home located in Clay County with nearby schools including Doniphan-Trumbull Elementary School and Doniphan-Trumbull Secondary School.
Ownership History
Date
Name
Owned For
Owner Type
Purchase Details
Closed on
Nov 3, 2008
Sold by
Farrall Heidi A
Bought by
Farrall Brent C
Current Estimated Value
Create a Home Valuation Report for This Property
The Home Valuation Report is an in-depth analysis detailing your home's value as well as a comparison with similar homes in the area
Purchase History
| Date | Buyer | Sale Price | Title Company |
|---|---|---|---|
| Farrall Brent C | -- | -- |
Source: Public Records
Tax History
| Year | Tax Paid | Tax Assessment Tax Assessment Total Assessment is a certain percentage of the fair market value that is determined by local assessors to be the total taxable value of land and additions on the property. | Land | Improvement |
|---|---|---|---|---|
| 2025 | $1,526 | $147,020 | $10,925 | $136,095 |
| 2024 | $1,527 | $143,265 | $10,925 | $132,340 |
| 2023 | $2,057 | $140,150 | $9,055 | $131,095 |
| 2022 | $2,031 | $129,710 | $6,035 | $123,675 |
| 2021 | $1,984 | $130,615 | $6,035 | $124,580 |
| 2020 | $1,933 | $132,860 | $6,035 | $126,825 |
| 2019 | $1,529 | $118,270 | $6,035 | $112,235 |
| 2018 | $1,281 | $100,170 | $6,035 | $94,135 |
| 2017 | $1,193 | $100,170 | $6,035 | $94,135 |
| 2016 | $1,211 | $100,170 | $6,035 | $94,135 |
| 2015 | $1,353 | $100,170 | $6,035 | $94,135 |
| 2014 | $1,253 | $100,170 | $6,035 | $94,135 |
| 2013 | $1,253 | $75,895 | $5,985 | $69,910 |
Source: Public Records
Map
Nearby Homes
- 10460 N Aspen Ave
- 210 E Buffalo Cir
- 635 E Lochland Rd
- 620 E Lochland Rd
- 15 Village Dr
- 401 W Lochland Rd
- 6000 Mallard Way
- 5905 Mallard Way
- 901 W Lochland Rd
- 6165 E South St
- 1741 Highland Dr
- 3205 Frahm Ln
- 3117 Frahm Ln
- 3013 W Laux Dr
- 3109 W Laux Dr
- 3107 W Laux Dr
- E 33rd St
- 3103 & 3101 W Laux Dr
- 1016 Highland Dr
- 825 Madden Rd
Your Personal Tour Guide
Ask me questions while you tour the home.