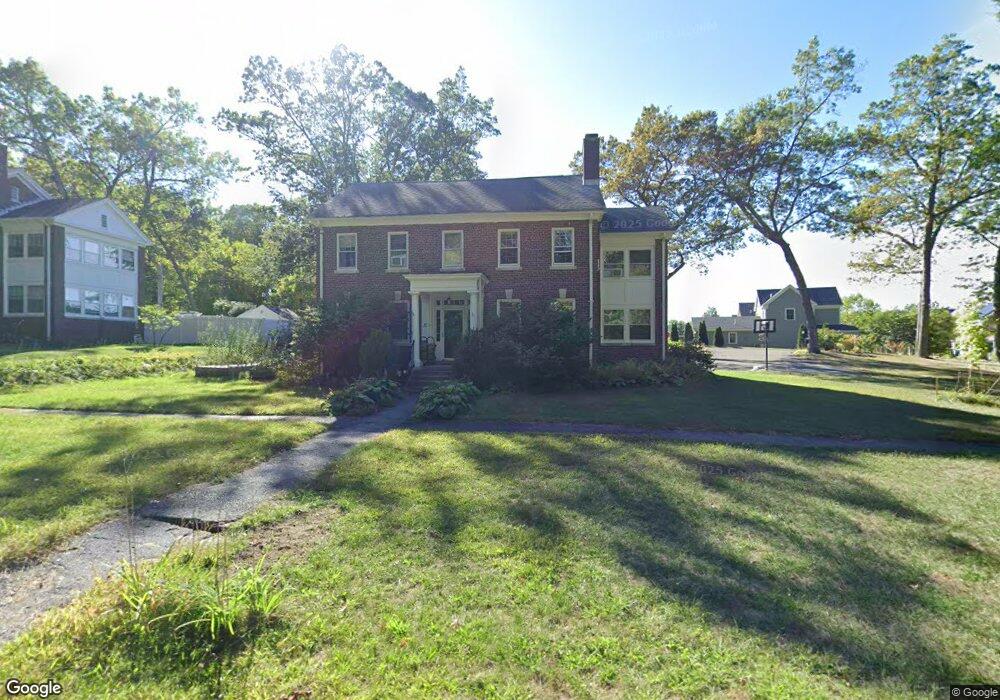
69 Walnut St Unit a Devens, MA 01434
Estimated Value: $612,544 - $741,000
3
Beds
3
Baths
2,590
Sq Ft
$258/Sq Ft
Est. Value
About This Home
This home is located at 69 Walnut St Unit a, Devens, MA 01434 and is currently estimated at $667,136, approximately $257 per square foot. 69 Walnut St Unit a is a home located in Worcester County with nearby schools including Hildreth Elementary School, The Bromfield School, and Francis W. Parker Charter Essential School.
Ownership History
Date
Name
Owned For
Owner Type
Purchase Details
Closed on
Jun 28, 2018
Sold by
Liu Zaipeng and Tian Jing
Bought by
Glynn David and Glynn Christie
Current Estimated Value
Home Financials for this Owner
Home Financials are based on the most recent Mortgage that was taken out on this home.
Original Mortgage
$367,625
Outstanding Balance
$319,306
Interest Rate
4.6%
Mortgage Type
New Conventional
Estimated Equity
$347,830
Purchase Details
Closed on
Jun 8, 2015
Sold by
Fnma
Bought by
Liu Zaipeng and Tian Jing
Home Financials for this Owner
Home Financials are based on the most recent Mortgage that was taken out on this home.
Original Mortgage
$189,500
Interest Rate
4%
Mortgage Type
New Conventional
Purchase Details
Closed on
Jun 3, 2015
Sold by
Hoarty 3Rd Patrick A and Ocwen Loan Servicing L
Bought by
Fnma
Home Financials for this Owner
Home Financials are based on the most recent Mortgage that was taken out on this home.
Original Mortgage
$189,500
Interest Rate
4%
Mortgage Type
New Conventional
Create a Home Valuation Report for This Property
The Home Valuation Report is an in-depth analysis detailing your home's value as well as a comparison with similar homes in the area
Home Values in the Area
Average Home Value in this Area
Purchase History
| Date | Buyer | Sale Price | Title Company |
|---|---|---|---|
| Glynn David | $432,500 | -- | |
| Glynn David | $432,500 | -- | |
| Liu Zaipeng | $379,000 | -- | |
| Liu Zaipeng | $379,000 | -- | |
| Fnma | $377,062 | -- | |
| Fnma | $377,062 | -- |
Source: Public Records
Mortgage History
| Date | Status | Borrower | Loan Amount |
|---|---|---|---|
| Open | Glynn David | $367,625 | |
| Closed | Glynn David | $367,625 | |
| Previous Owner | Liu Zaipeng | $189,500 |
Source: Public Records
Tax History Compared to Growth
Tax History
| Year | Tax Paid | Tax Assessment Tax Assessment Total Assessment is a certain percentage of the fair market value that is determined by local assessors to be the total taxable value of land and additions on the property. | Land | Improvement |
|---|---|---|---|---|
| 2025 | $6,428 | $512,200 | $147,700 | $364,500 |
| 2024 | $6,338 | $490,200 | $139,200 | $351,000 |
| 2023 | $6,278 | $462,300 | $139,200 | $323,100 |
| 2022 | $6,332 | $417,100 | $139,200 | $277,900 |
| 2021 | $6,462 | $414,500 | $139,200 | $275,300 |
| 2020 | $6,374 | $397,400 | $139,200 | $258,200 |
| 2019 | $6,195 | $391,100 | $134,200 | $256,900 |
| 2018 | $6,009 | $388,200 | $134,200 | $254,000 |
| 2017 | $5,827 | $359,000 | $111,200 | $247,800 |
| 2016 | $5,631 | $337,400 | $107,200 | $230,200 |
Source: Public Records
Map
Nearby Homes
- 14 Cavite St
- 53 Walker Rd
- 78 Walker Rd
- 31 Independence Dr
- 184 W Main St Unit B2
- 29 Clark Rd
- 83 Clark Rd Unit 38
- 16 Myles Ln
- 67 Front St
- 40 Ayer Rd
- 30 Ayer Rd
- 4 Hill Ln
- 35 Fredonian St Unit K
- 3 Mill St
- 7 Ambrose Way Unit 5
- 6 Ambrose Way Unit 3
- 17 Ambrose Way Unit 17
- 9 Ambrose Way Unit 9
- 5 Ambrose Way Unit 5
- 3 Ambrose Way Unit 3
- 69 Walnut St Unit 69
- 69 Walnut St
- 67 Walnut St
- 15 Chance St
- 65 Walnut St
- 19 Chance St
- 21 Chance St Unit A
- 21 Chance St Unit B
- 21 Chance St
- 16 Chance St
- 63 Walnut St
- 18 Chance St Unit A
- 18 Chance St Unit B
- 18 Chance St
- 22 Chance St
- 23 Chance St
- 20 Chance St
- 61 Walnut St
- 63 Walnut St Devens
- 25 Chance St