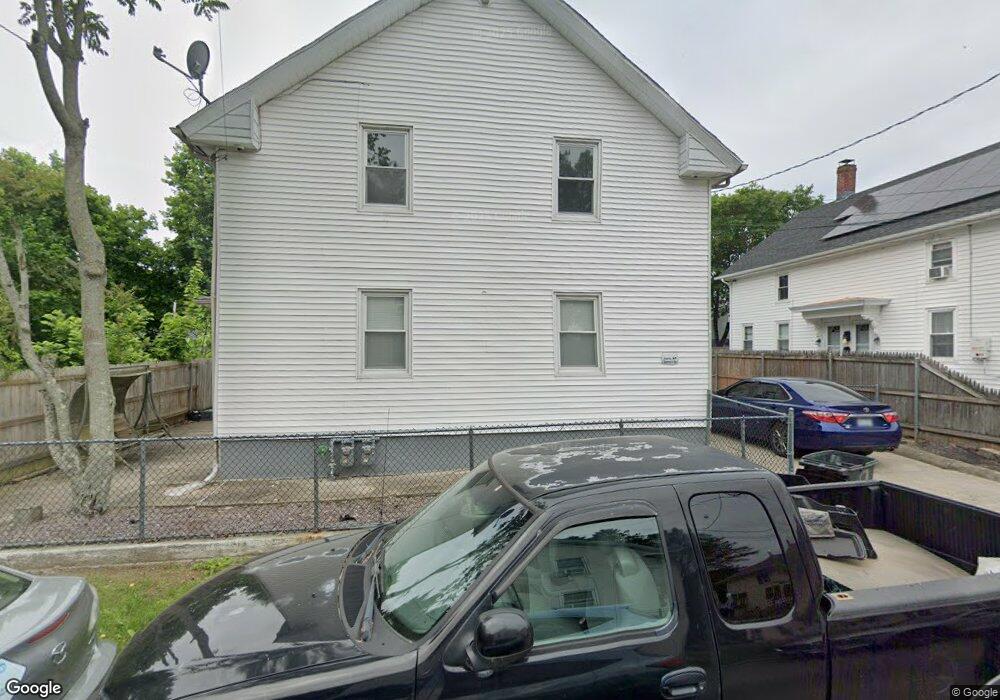
69 Walnut St Johnston, RI 02919
Thornton NeighborhoodEstimated Value: $450,381 - $500,000
5
Beds
2
Baths
1,971
Sq Ft
$247/Sq Ft
Est. Value
About This Home
This home is located at 69 Walnut St, Johnston, RI 02919 and is currently estimated at $486,345, approximately $246 per square foot. 69 Walnut St is a home located in Providence County with nearby schools including Johnston Senior High School, Achievement First Promesa, and St Rocco School.
Ownership History
Date
Name
Owned For
Owner Type
Purchase Details
Closed on
Nov 2, 2010
Sold by
Renacimiento Rt
Bought by
Rivas Nelson
Current Estimated Value
Home Financials for this Owner
Home Financials are based on the most recent Mortgage that was taken out on this home.
Original Mortgage
$165,767
Outstanding Balance
$110,038
Interest Rate
4.39%
Mortgage Type
Purchase Money Mortgage
Estimated Equity
$376,307
Purchase Details
Closed on
Nov 3, 2009
Sold by
Read Lynda
Bought by
Renacimiento Rlty
Create a Home Valuation Report for This Property
The Home Valuation Report is an in-depth analysis detailing your home's value as well as a comparison with similar homes in the area
Home Values in the Area
Average Home Value in this Area
Purchase History
| Date | Buyer | Sale Price | Title Company |
|---|---|---|---|
| Rivas Nelson | $168,000 | -- | |
| Rivas Nelson | $168,000 | -- | |
| Renacimiento Rlty | -- | -- | |
| Renacimiento Rlty | -- | -- |
Source: Public Records
Mortgage History
| Date | Status | Borrower | Loan Amount |
|---|---|---|---|
| Open | Renacimiento Rlty | $165,767 | |
| Closed | Renacimiento Rlty | $165,767 | |
| Closed | Renacimiento Rlty | $17,500 | |
| Previous Owner | Renacimiento Rlty | $57,000 |
Source: Public Records
Tax History
| Year | Tax Paid | Tax Assessment Tax Assessment Total Assessment is a certain percentage of the fair market value that is determined by local assessors to be the total taxable value of land and additions on the property. | Land | Improvement |
|---|---|---|---|---|
| 2025 | $5,078 | $325,100 | $75,400 | $249,700 |
| 2024 | $4,974 | $325,100 | $75,400 | $249,700 |
| 2023 | $4,974 | $325,100 | $75,400 | $249,700 |
| 2022 | $9,419 | $228,000 | $53,600 | $174,400 |
| 2021 | $5,299 | $228,000 | $53,600 | $174,400 |
| 2018 | $5,212 | $189,600 | $46,100 | $143,500 |
| 2016 | $6,896 | $189,600 | $46,100 | $143,500 |
| 2015 | $4,386 | $151,300 | $41,900 | $109,400 |
| 2014 | $4,350 | $151,300 | $41,900 | $109,400 |
| 2013 | $4,350 | $151,300 | $41,900 | $109,400 |
Source: Public Records
Map
Nearby Homes
- 73 Maple Ave
- 82 Clemence St
- 0 Clemence St
- 50 Clemence St Unit 50
- 83 Valente Dr
- 0 Myrtle Ave
- 47 Morgan Ave Unit 37
- 0 Plainfield Pike Unit 1374314
- 30 S Bennett Dr
- 0 Ipswich St
- 93 Elena St
- 0 Macera Dr
- 9 Baker St
- 16 Shaw Ave
- 15 Vallone Rd
- 5 Deluca St
- 00 Burton St
- 32 Harrington Dr
- 33 Prudence Ave
- 92 Old Oak Ave
Your Personal Tour Guide
Ask me questions while you tour the home.