Estimated Value: $398,000 - $685,000
4
Beds
2
Baths
1,824
Sq Ft
$274/Sq Ft
Est. Value
About This Home
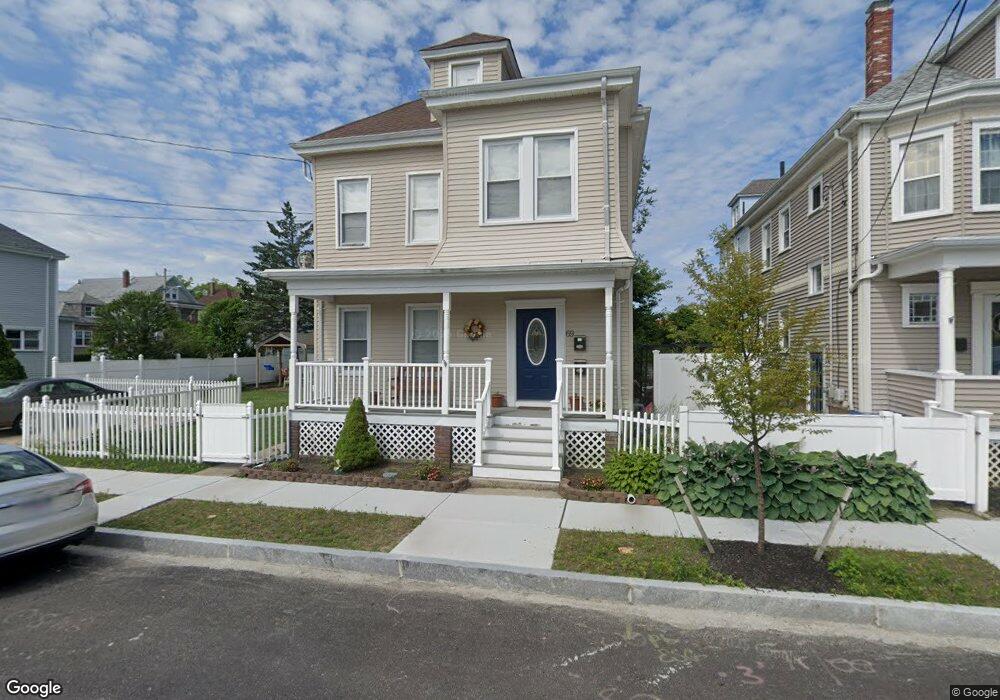
This home is located at 69 West St, New Bedford, MA 02740 and is currently estimated at $499,345, approximately $273 per square foot. 69 West St is a home located in Bristol County with nearby schools including Betsey B. Winslow Elementary School, Keith Middle School, and New Bedford High School.
Ownership History
Date
Name
Owned For
Owner Type
Purchase Details
Closed on
Jun 30, 1999
Sold by
Armanetti \Peter M and Armanetti Jennifer L
Bought by
Cimbron Arthur J
Current Estimated Value
Purchase Details
Closed on
Aug 31, 1992
Sold by
Federal Home Loan Mortgage Corporation
Bought by
Armanetti Peter M and Ormonde Jennifer
Purchase Details
Closed on
Mar 31, 1992
Sold by
Alton Douglas C
Bought by
Fhlmc
Create a Home Valuation Report for This Property
The Home Valuation Report is an in-depth analysis detailing your home's value as well as a comparison with similar homes in the area
Home Values in the Area
Average Home Value in this Area
Purchase History
| Date | Buyer | Sale Price | Title Company |
|---|---|---|---|
| Cimbron Arthur J | $113,000 | -- | |
| Cimbron Arthur J | $113,000 | -- | |
| Armanetti Peter M | $61,800 | -- | |
| Armanetti Peter M | $61,800 | -- | |
| Fhlmc | $72,744 | -- | |
| Fhlmc | $72,744 | -- |
Source: Public Records
Mortgage History
| Date | Status | Borrower | Loan Amount |
|---|---|---|---|
| Open | Fhlmc | $30,000 | |
| Open | Fhlmc | $132,338 |
Source: Public Records
Tax History Compared to Growth
Tax History
| Year | Tax Paid | Tax Assessment Tax Assessment Total Assessment is a certain percentage of the fair market value that is determined by local assessors to be the total taxable value of land and additions on the property. | Land | Improvement |
|---|---|---|---|---|
| 2025 | $4,328 | $382,700 | $100,500 | $282,200 |
| 2024 | $3,845 | $320,400 | $102,100 | $218,300 |
| 2023 | $3,703 | $259,100 | $88,100 | $171,000 |
| 2022 | $3,364 | $216,500 | $83,700 | $132,800 |
| 2021 | $3,375 | $216,500 | $83,700 | $132,800 |
| 2020 | $3,398 | $210,300 | $83,700 | $126,600 |
| 2019 | $3,334 | $202,400 | $83,700 | $118,700 |
| 2018 | $3,203 | $192,600 | $83,700 | $108,900 |
| 2017 | $2,957 | $177,200 | $83,700 | $93,500 |
| 2016 | $2,859 | $173,400 | $83,700 | $89,700 |
| 2015 | $2,680 | $170,400 | $83,700 | $86,700 |
| 2014 | $2,515 | $165,900 | $78,700 | $87,200 |
Source: Public Records
Map
Nearby Homes