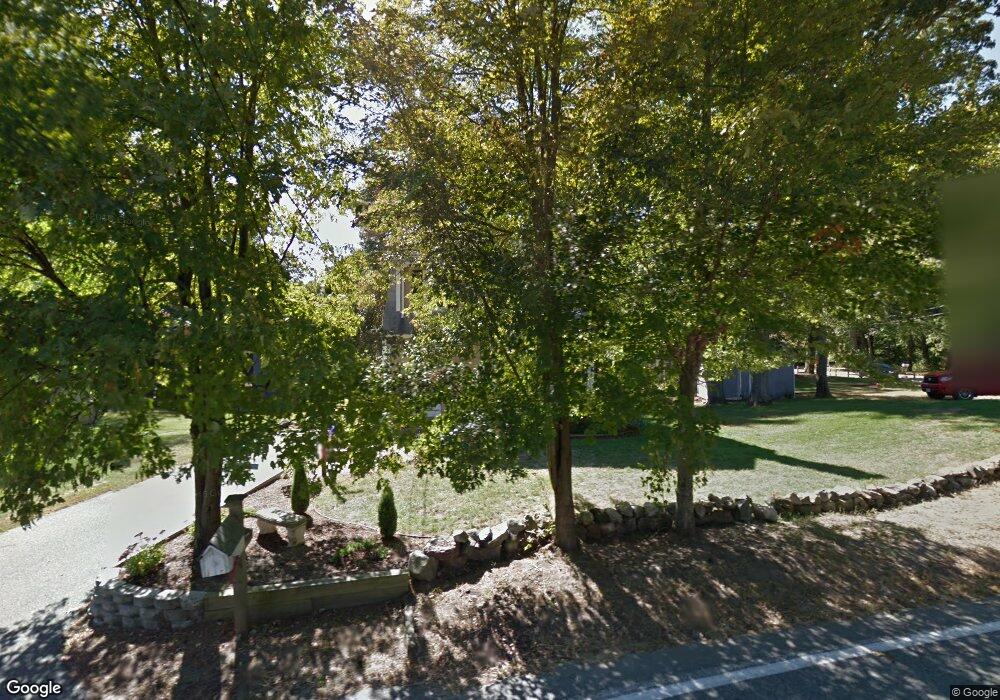
69 West St Wilmington, MA 01887
Estimated Value: $635,000 - $719,000
3
Beds
1
Bath
1,540
Sq Ft
$434/Sq Ft
Est. Value
About This Home
This home is located at 69 West St, Wilmington, MA 01887 and is currently estimated at $668,626, approximately $434 per square foot. 69 West St is a home located in Middlesex County with nearby schools including Wilmington Middle School, Wilmington High School, and Austin Preparatory School.
Ownership History
Date
Name
Owned For
Owner Type
Purchase Details
Closed on
May 27, 2004
Sold by
White James R and Scaramozzino Ann M
Bought by
Spencer Mary B
Current Estimated Value
Home Financials for this Owner
Home Financials are based on the most recent Mortgage that was taken out on this home.
Original Mortgage
$313,400
Outstanding Balance
$151,967
Interest Rate
5.88%
Mortgage Type
Purchase Money Mortgage
Estimated Equity
$516,659
Create a Home Valuation Report for This Property
The Home Valuation Report is an in-depth analysis detailing your home's value as well as a comparison with similar homes in the area
Home Values in the Area
Average Home Value in this Area
Purchase History
| Date | Buyer | Sale Price | Title Company |
|---|---|---|---|
| Spencer Mary B | $355,000 | -- |
Source: Public Records
Mortgage History
| Date | Status | Borrower | Loan Amount |
|---|---|---|---|
| Open | Spencer Mary B | $313,400 |
Source: Public Records
Tax History Compared to Growth
Tax History
| Year | Tax Paid | Tax Assessment Tax Assessment Total Assessment is a certain percentage of the fair market value that is determined by local assessors to be the total taxable value of land and additions on the property. | Land | Improvement |
|---|---|---|---|---|
| 2025 | $6,504 | $568,000 | $270,700 | $297,300 |
| 2024 | $6,388 | $558,900 | $270,700 | $288,200 |
| 2023 | $5,976 | $500,500 | $246,000 | $254,500 |
| 2022 | $5,599 | $429,700 | $205,000 | $224,700 |
| 2021 | $5,497 | $397,200 | $186,300 | $210,900 |
| 2020 | $5,224 | $384,700 | $186,300 | $198,400 |
| 2019 | $5,037 | $366,300 | $177,500 | $188,800 |
| 2018 | $4,909 | $340,700 | $169,000 | $171,700 |
| 2017 | $4,738 | $327,900 | $160,000 | $167,900 |
| 2016 | $4,443 | $303,700 | $152,400 | $151,300 |
| 2015 | $4,291 | $298,600 | $152,400 | $146,200 |
| 2014 | $4,003 | $281,100 | $145,100 | $136,000 |
Source: Public Records
Map
Nearby Homes
- 3 Strout Ave
- 203 Lowell St Unit 119
- 203 Lowell St Unit 115
- 203 Lowell St Unit 220
- 203 Lowell St Unit 103
- 1 March Rd
- 5 Morse Ave
- 452 Lowell St
- 3 Bradford Rd
- 2 Inwood Dr Unit 1010
- 17 Molloy Rd
- 33 Marla Ln
- 99 Grove St
- 61 Lowell St
- 5 Flynn Way
- 7 Cross St Unit 306
- 7 Cross St Unit 304
- 7 Cross St Unit 205
- 9 Parker St
- 28 Martin Rd