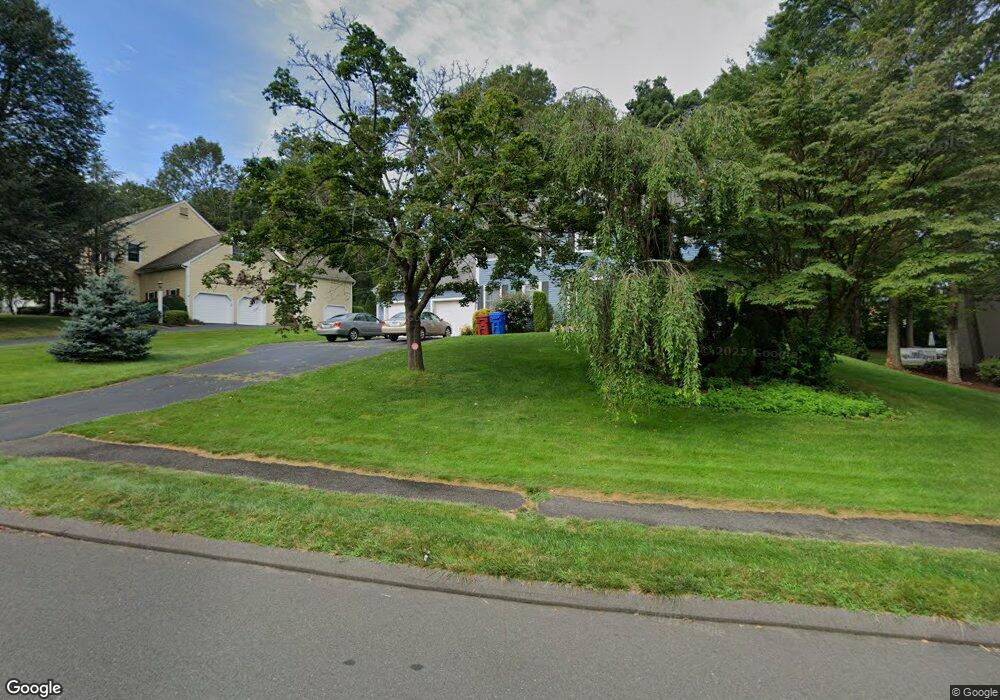
69 Westview Terrace Unionville, CT 06085
Estimated Value: $734,761 - $899,000
4
Beds
3
Baths
2,864
Sq Ft
$275/Sq Ft
Est. Value
About This Home
This home is located at 69 Westview Terrace, Unionville, CT 06085 and is currently estimated at $786,190, approximately $274 per square foot. 69 Westview Terrace is a home located in Hartford County with nearby schools including West Woods Upper Elementary School, Irving A. Robbins Middle School, and Farmington High School.
Ownership History
Date
Name
Owned For
Owner Type
Purchase Details
Closed on
Dec 5, 2024
Sold by
Rahmig Richard A and Rahmig Nancy L
Bought by
Rahmig Ft and Rahmig
Current Estimated Value
Purchase Details
Closed on
Dec 31, 1998
Sold by
Curcio Eugene R and Curcio Deborah J
Bought by
Pahumig Richard A and Pahumig Nancy L
Home Financials for this Owner
Home Financials are based on the most recent Mortgage that was taken out on this home.
Original Mortgage
$100,000
Interest Rate
6.84%
Purchase Details
Closed on
Oct 6, 1988
Sold by
Lemon David M
Bought by
Curcio Eugene R
Home Financials for this Owner
Home Financials are based on the most recent Mortgage that was taken out on this home.
Original Mortgage
$275,000
Interest Rate
10.64%
Mortgage Type
Purchase Money Mortgage
Create a Home Valuation Report for This Property
The Home Valuation Report is an in-depth analysis detailing your home's value as well as a comparison with similar homes in the area
Home Values in the Area
Average Home Value in this Area
Purchase History
| Date | Buyer | Sale Price | Title Company |
|---|---|---|---|
| Rahmig Ft | -- | None Available | |
| Rahmig Ft | -- | None Available | |
| Pahumig Richard A | $314,000 | -- | |
| Pahumig Richard A | $314,000 | -- | |
| Curcio Eugene R | $375,000 | -- |
Source: Public Records
Mortgage History
| Date | Status | Borrower | Loan Amount |
|---|---|---|---|
| Previous Owner | Curcio Eugene R | $100,000 | |
| Previous Owner | Curcio Eugene R | $275,000 |
Source: Public Records
Tax History Compared to Growth
Tax History
| Year | Tax Paid | Tax Assessment Tax Assessment Total Assessment is a certain percentage of the fair market value that is determined by local assessors to be the total taxable value of land and additions on the property. | Land | Improvement |
|---|---|---|---|---|
| 2025 | $10,169 | $381,990 | $92,890 | $289,100 |
| 2024 | $9,722 | $381,990 | $92,890 | $289,100 |
| 2023 | $9,248 | $381,990 | $92,890 | $289,100 |
| 2022 | $8,633 | $294,450 | $78,060 | $216,390 |
| 2021 | $8,483 | $294,450 | $78,060 | $216,390 |
| 2020 | $8,236 | $294,450 | $78,060 | $216,390 |
| 2019 | $8,236 | $294,450 | $78,060 | $216,390 |
| 2018 | $8,003 | $294,450 | $78,060 | $216,390 |
| 2017 | $7,569 | $283,690 | $88,200 | $195,490 |
| 2016 | $7,314 | $283,690 | $88,200 | $195,490 |
| 2015 | $7,095 | $283,690 | $88,200 | $195,490 |
| 2014 | $6,933 | $283,690 | $88,200 | $195,490 |
Source: Public Records
Map
Nearby Homes
- 54 Westview Terrace
- 267 New Britain Ave
- 243 New Britain Ave Unit 243
- 27 Westview Terrace
- 1622 Farmington Ave Unit 4
- 55 Depot Place
- 6 Burlington Rd
- 20 Briarwood Rd
- 31 Railroad Ave
- 487 Plainville Ave
- 14 Springwood Rd
- 115 W Avon Rd
- 20 Farm Dr
- 54 Pinewood Dr
- 61 Litchfield Rd
- 69 Lake Garda Dr
- 148 River Rd
- 49 Northwoods Rd
- 3 Heritage Dr
- 94 Sanford Ave
- 67 Westview Terrace
- 73 Westview Terrace
- 70 Westview Terrace
- 68 Westview Terrace
- 63 Westview Terrace
- 72 Westview Terrace
- 66 Westview Terrace
- 17 Mals Way
- 74 Westview Terrace
- 64 Westview Terrace
- 19 Mals Way
- 15 Mals Way
- 61 Westview Terrace
- 76 Westview Terrace
- 95 Oakridge
- 62 Westview Terrace
- 89 Oakridge
- 81 Westview Terrace
- 78 Westview Terrace
- 20 Mals Way