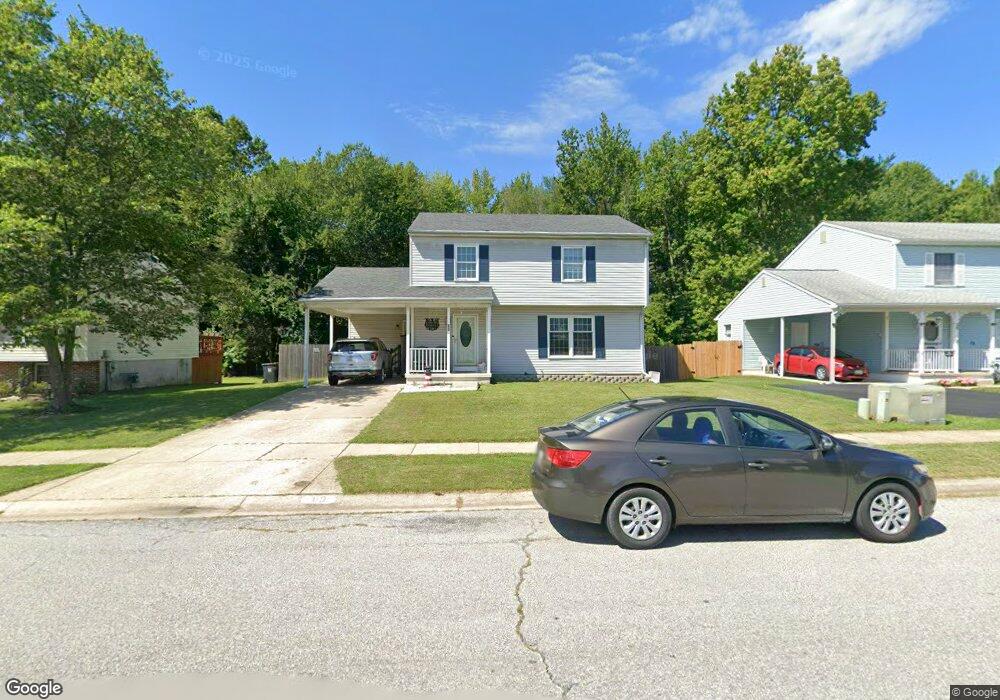
69 Winchester Dr Elkton, MD 21921
Estimated Value: $314,000 - $355,000
--
Bed
3
Baths
1,720
Sq Ft
$194/Sq Ft
Est. Value
About This Home
This home is located at 69 Winchester Dr, Elkton, MD 21921 and is currently estimated at $333,622, approximately $193 per square foot. 69 Winchester Dr is a home located in Cecil County with nearby schools including Cecil Manor Elementary School, Cherry Hill Middle School, and Elkton High School.
Ownership History
Date
Name
Owned For
Owner Type
Purchase Details
Closed on
Jan 15, 2021
Sold by
Ferebee Carl F
Bought by
Garcia Wesley Monica and Garcia Wesley Michelle
Current Estimated Value
Home Financials for this Owner
Home Financials are based on the most recent Mortgage that was taken out on this home.
Original Mortgage
$220,924
Outstanding Balance
$197,175
Interest Rate
2.71%
Mortgage Type
New Conventional
Estimated Equity
$136,447
Purchase Details
Closed on
Nov 20, 1998
Sold by
Mangini Anthony E and Mangini Diana L
Bought by
Ferebee Carl F
Purchase Details
Closed on
Sep 24, 1997
Sold by
Sibol Jon P and Sibol Tracey A
Bought by
Mangini Anthony E and Mangini Diana L
Purchase Details
Closed on
Dec 13, 1990
Sold by
Pettinaro Enterprises
Bought by
Sibol Jon P and Sibol Tracey A
Home Financials for this Owner
Home Financials are based on the most recent Mortgage that was taken out on this home.
Original Mortgage
$102,000
Interest Rate
9.81%
Create a Home Valuation Report for This Property
The Home Valuation Report is an in-depth analysis detailing your home's value as well as a comparison with similar homes in the area
Home Values in the Area
Average Home Value in this Area
Purchase History
| Date | Buyer | Sale Price | Title Company |
|---|---|---|---|
| Garcia Wesley Monica | $225,000 | Sage Title Group Llc | |
| Ferebee Carl F | $124,900 | -- | |
| Mangini Anthony E | $117,900 | -- | |
| Sibol Jon P | $113,800 | -- |
Source: Public Records
Mortgage History
| Date | Status | Borrower | Loan Amount |
|---|---|---|---|
| Open | Garcia Wesley Monica | $220,924 | |
| Closed | Garcia Wesley Monica | $6,627 | |
| Previous Owner | Sibol Jon P | $102,000 | |
| Closed | Mangini Anthony E | -- |
Source: Public Records
Tax History Compared to Growth
Tax History
| Year | Tax Paid | Tax Assessment Tax Assessment Total Assessment is a certain percentage of the fair market value that is determined by local assessors to be the total taxable value of land and additions on the property. | Land | Improvement |
|---|---|---|---|---|
| 2025 | $2,502 | $228,600 | $60,200 | $168,400 |
| 2024 | $2,042 | $218,533 | $0 | $0 |
| 2023 | $1,602 | $208,467 | $0 | $0 |
| 2022 | $2,235 | $198,400 | $60,200 | $138,200 |
| 2021 | $2,190 | $189,267 | $0 | $0 |
| 2020 | $4,026 | $180,133 | $0 | $0 |
| 2019 | $1,972 | $171,000 | $35,600 | $135,400 |
| 2018 | $1,960 | $169,933 | $0 | $0 |
| 2017 | $1,852 | $168,867 | $0 | $0 |
| 2016 | $1,850 | $167,800 | $0 | $0 |
| 2015 | $1,850 | $167,800 | $0 | $0 |
| 2014 | $1,923 | $167,800 | $0 | $0 |
Source: Public Records
Map
Nearby Homes
- 25 Cherry Ln
- 14 Apple Ln
- 22 Buttonbush Ct
- 72 Mule Deer Ct
- 1450 Appleton Rd
- 43 Buttercup Cir
- 11 Buttercup Cir
- 57 Gypsum Dr Unit 195
- HAYDEN Plan at Barksdale Crossing
- GALEN Plan at Barksdale Crossing
- HAMPSHIRE Plan at Barksdale Crossing
- HANOVER Plan at Barksdale Crossing
- 779 Chestnut Hill Rd
- 23 Maple Dr Unit 16
- 544 Elk Mills Rd
- 117 W Shetland Ct
- 1003 Jackson Hall School Rd
- 201 Johnstown Rd
- 368 Appleton Rd
- 36 Julie Ln
- 75 Winchester Dr
- 63 Winchester Dr
- 83 Winchester Dr
- 57 Winchester Dr
- 60 Winchester Dr
- 66 Winchester Dr
- 89 Winchester Dr
- 53 Winchester Dr
- 54 Winchester Dr
- 7 Palomino Place
- 4 Appaloosa Trail
- 8 Palomino Place
- 1 Cimarron Cir
- 49 Winchester Dr
- 10 Appaloosa Trail
- 13 Palomino Place
- 14 Palomino Place
- 5 Cimarron Cir
- 95 Winchester Dr
- 16 Appaloosa Trail