
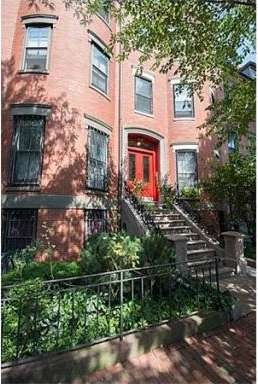
69 Worcester St Unit 3 Boston, MA 02118
South End Neighborhood
1
Bed
1
Bath
694
Sq Ft
697
Sq Ft Lot
About This Home
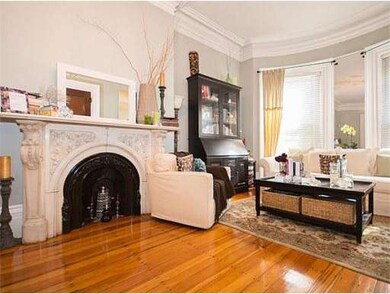
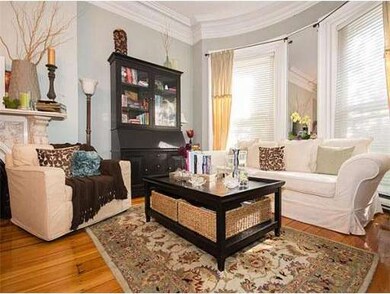
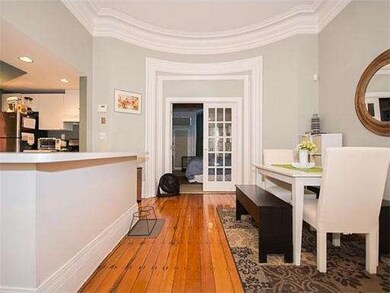
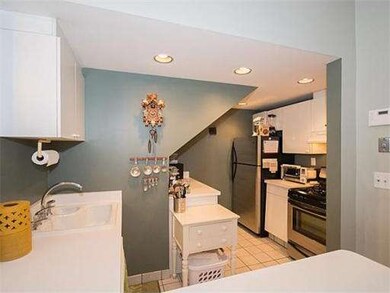
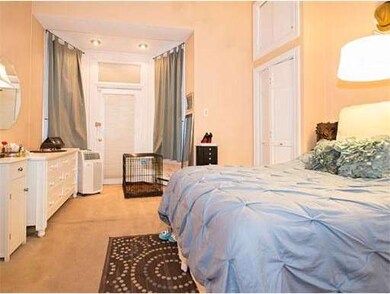
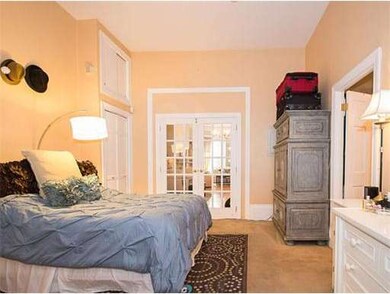
As of July 2017Beautiful and well maintained 1 bedroom condo on a conveniently located street near the heart of the South End. This wonderfully detailed home offers an open floor plan and comes with hardwood floors, high ceilings, a decorative fireplace, French doors, and a small balcony located off of the bedroom. This home has plenty of closet space as well as the washer/dryer located in the unit. Located near the T, shopping and fabulous restaurants!
Last Agent to Sell the Property
Michael Burak
Keller Williams Realty Boston Northwest License #579507394 Listed on: 09/04/2013
Property Details
Home Type
Condominium
Est. Annual Taxes
$7,268
Year Built
1900
Lot Details
0
Listing Details
- Unit Level: 1
- Special Features: None
- Property Sub Type: Condos
- Year Built: 1900
Interior Features
- Has Basement: No
- Number of Rooms: 3
- Flooring: Wood, Tile, Wall to Wall Carpet
- Kitchen: First Floor
- Living Room: First Floor
- Master Bedroom: First Floor
- Master Bedroom Description: Bathroom - Full, Closet, Flooring - Wall to Wall Carpet, Balcony - Exterior, French Doors
Exterior Features
- Exterior: Brick
- Exterior Unit Features: Balcony
Garage/Parking
- Parking: On Street Permit
- Parking Spaces: 0
Utilities
- Heat Zones: 2
Condo/Co-op/Association
- Association Fee Includes: Water, Sewer, Master Insurance, Gas
- Association Pool: No
- Pets Allowed: Yes
- No Units: 5
- Unit Building: 3
Ownership History
Date
Name
Owned For
Owner Type
Purchase Details
Listed on
Apr 19, 2017
Closed on
Jul 17, 2017
Sold by
Location Wise Llc
Bought by
Parthelon Boston Llc
Seller's Agent
Brian Tierney
Rondeau/Tierney Real Estate, LLC
Buyer's Agent
martin kyne
Rondeau/Tierney Real Estate, LLC
List Price
$635,000
Sold Price
$610,000
Premium/Discount to List
-$25,000
-3.94%
Current Estimated Value
Home Financials for this Owner
Home Financials are based on the most recent Mortgage that was taken out on this home.
Estimated Appreciation
$131,818
Avg. Annual Appreciation
2.46%
Original Mortgage
$457,500
Outstanding Balance
$385,771
Interest Rate
4%
Mortgage Type
New Conventional
Estimated Equity
$356,047
Purchase Details
Listed on
Sep 4, 2013
Closed on
Oct 4, 2013
Sold by
Davis Desiree D
Bought by
Location Wise Llc
Seller's Agent
Michael Burak
Keller Williams Realty Boston Northwest
Buyer's Agent
Roberta Orlandino
Coldwell Banker Realty - Boston
List Price
$439,900
Sold Price
$439,900
Home Financials for this Owner
Home Financials are based on the most recent Mortgage that was taken out on this home.
Avg. Annual Appreciation
9.01%
Purchase Details
Closed on
Jan 17, 2007
Sold by
Kiely Margaret E
Bought by
Davis Desiree D
Home Financials for this Owner
Home Financials are based on the most recent Mortgage that was taken out on this home.
Original Mortgage
$300,000
Interest Rate
6.14%
Mortgage Type
Purchase Money Mortgage
Purchase Details
Closed on
Jan 23, 2004
Sold by
Newman David C
Bought by
Kiely Margaret E
Purchase Details
Closed on
Mar 22, 1999
Sold by
Alterwitz Barry N
Bought by
Newman David C
Purchase Details
Closed on
Aug 4, 1998
Sold by
Mcveigh Michael J and Bird Michael T
Bought by
Alterwitz Barry N
Purchase Details
Closed on
May 30, 1997
Sold by
Symmes Deborah
Bought by
Mcveigh Michael J and Bird Michael T
Similar Homes in the area
Create a Home Valuation Report for This Property
The Home Valuation Report is an in-depth analysis detailing your home's value as well as a comparison with similar homes in the area
Home Values in the Area
Average Home Value in this Area
Purchase History
| Date | Type | Sale Price | Title Company |
|---|---|---|---|
| Deed | $610,000 | -- | |
| Not Resolvable | $439,900 | -- | |
| Deed | $375,000 | -- | |
| Deed | $375,000 | -- | |
| Deed | $360,000 | -- | |
| Deed | $227,500 | -- | |
| Deed | $200,000 | -- | |
| Deed | $155,000 | -- |
Source: Public Records
Mortgage History
| Date | Status | Loan Amount | Loan Type |
|---|---|---|---|
| Open | $457,500 | New Conventional | |
| Previous Owner | $300,000 | No Value Available | |
| Previous Owner | $300,000 | Purchase Money Mortgage | |
| Previous Owner | $37,500 | No Value Available |
Source: Public Records
Property History
| Date | Event | Price | Change | Sq Ft Price |
|---|---|---|---|---|
| 09/20/2021 09/20/21 | Rented | -- | -- | -- |
| 09/03/2021 09/03/21 | Under Contract | -- | -- | -- |
| 09/01/2021 09/01/21 | For Rent | $2,500 | +13.6% | -- |
| 11/05/2020 11/05/20 | Rented | $2,200 | 0.0% | -- |
| 11/02/2020 11/02/20 | Under Contract | -- | -- | -- |
| 10/19/2020 10/19/20 | Price Changed | $2,200 | -8.3% | $3 / Sq Ft |
| 09/21/2020 09/21/20 | For Rent | $2,400 | -9.4% | -- |
| 02/01/2019 02/01/19 | Rented | $2,650 | 0.0% | -- |
| 01/17/2019 01/17/19 | Under Contract | -- | -- | -- |
| 12/28/2018 12/28/18 | For Rent | $2,650 | +1.9% | -- |
| 10/15/2017 10/15/17 | Rented | $2,600 | 0.0% | -- |
| 10/12/2017 10/12/17 | Under Contract | -- | -- | -- |
| 09/30/2017 09/30/17 | Price Changed | $2,600 | -7.1% | $4 / Sq Ft |
| 09/05/2017 09/05/17 | For Rent | $2,800 | 0.0% | -- |
| 07/17/2017 07/17/17 | Sold | $610,000 | -3.9% | $879 / Sq Ft |
| 06/05/2017 06/05/17 | Pending | -- | -- | -- |
| 04/19/2017 04/19/17 | For Sale | $635,000 | +44.4% | $915 / Sq Ft |
| 10/04/2013 10/04/13 | Sold | $439,900 | 0.0% | $634 / Sq Ft |
| 09/12/2013 09/12/13 | Off Market | $439,900 | -- | -- |
| 09/04/2013 09/04/13 | For Sale | $439,900 | 0.0% | $634 / Sq Ft |
| 05/05/2012 05/05/12 | Rented | $2,400 | 0.0% | -- |
| 05/05/2012 05/05/12 | For Rent | $2,400 | -- | -- |
Source: MLS Property Information Network (MLS PIN)
Tax History Compared to Growth
Tax History
| Year | Tax Paid | Tax Assessment Tax Assessment Total Assessment is a certain percentage of the fair market value that is determined by local assessors to be the total taxable value of land and additions on the property. | Land | Improvement |
|---|---|---|---|---|
| 2025 | $7,268 | $627,600 | $0 | $627,600 |
| 2024 | $6,638 | $609,000 | $0 | $609,000 |
| 2023 | $6,411 | $596,900 | $0 | $596,900 |
| 2022 | $6,431 | $591,100 | $0 | $591,100 |
| 2021 | $6,183 | $579,500 | $0 | $579,500 |
| 2020 | $5,771 | $546,500 | $0 | $546,500 |
| 2019 | $5,591 | $530,500 | $0 | $530,500 |
| 2018 | $5,403 | $515,600 | $0 | $515,600 |
| 2017 | $5,201 | $491,100 | $0 | $491,100 |
| 2016 | $5,194 | $472,200 | $0 | $472,200 |
| 2015 | $5,396 | $445,600 | $0 | $445,600 |
| 2014 | $5,087 | $404,400 | $0 | $404,400 |
Source: Public Records
Agents Affiliated with this Home
-
m
Seller's Agent in 2021
martin kyne
Rondeau/Tierney Real Estate, LLC
-
Buyer's Agent in 2021
Brian Tierney
Rondeau/Tierney Real Estate, LLC
(617) 797-1018
6 in this area
8 Total Sales
-
W
Buyer's Agent in 2019
Wilfredo Miguez
Keller Williams Realty Boston-Metro | Back Bay
-
Buyer's Agent in 2017
Dj Gendreau
Douglas Elliman Real Estate - Park Plaza
(508) 269-5468
11 Total Sales
-
M
Seller's Agent in 2013
Michael Burak
Keller Williams Realty Boston Northwest
-
Buyer's Agent in 2013
Roberta Orlandino
Coldwell Banker Realty - Boston
(617) 312-1511
9 in this area
48 Total Sales
Map
Source: MLS Property Information Network (MLS PIN)
MLS Number: 71577667
APN: CBOS-000000-000009-000559-000006
Disclaimer: Certain information contained herein is derived from information provided by parties other than Homes.com. All information provided is deemed reliable, but is not guaranteed to be accurate and should be independently verified.
![]() The property listing data and information, or the Images, set forth herein were provided to MLS Property Information Network, Inc. from third party sources, including sellers, lessors and public records, and were compiled by MLS Property Information Network, Inc. The property listing data and information, and the Images, are for the personal, non-commercial use of consumers having a good faith interest in purchasing or leasing listed properties of the type displayed to them and may not be used for any purpose other than to identify prospective properties which such consumers may have a good faith interest in purchasing or leasing. MLS Property Information Network, Inc. and its subscribers disclaim any and all representations and warranties as to the accuracy of the property listing data and information, or as to the accuracy of any of the Images, set forth herein.
The property listing data and information, or the Images, set forth herein were provided to MLS Property Information Network, Inc. from third party sources, including sellers, lessors and public records, and were compiled by MLS Property Information Network, Inc. The property listing data and information, and the Images, are for the personal, non-commercial use of consumers having a good faith interest in purchasing or leasing listed properties of the type displayed to them and may not be used for any purpose other than to identify prospective properties which such consumers may have a good faith interest in purchasing or leasing. MLS Property Information Network, Inc. and its subscribers disclaim any and all representations and warranties as to the accuracy of the property listing data and information, or as to the accuracy of any of the Images, set forth herein.
Nearby Homes
- 69 Worcester St Unit 5
- 80 Worcester St Unit A
- 86 Worcester St Unit 4
- 51 Worcester St Unit 2
- 116 W Concord St Unit 4
- 133 W Concord St Unit A
- 41 Worcester St Unit 2
- 66 Rutland St
- 99 W Springfield St
- 71 Rutland St Unit 4
- 486 Shawmut Ave Unit 1
- 692 Tremont St Unit 6
- 8 Concord Square Unit 1
- 520 Shawmut Ave Unit 1
- 8 Rutland Square Unit 2
- 94 W Springfield St Unit 1
- 15 Concord Square Unit 1A
- 577 Massachusetts Ave Unit PH
- 577 Massachusetts Ave Unit C
- 492 Massachusetts Ave Unit 53