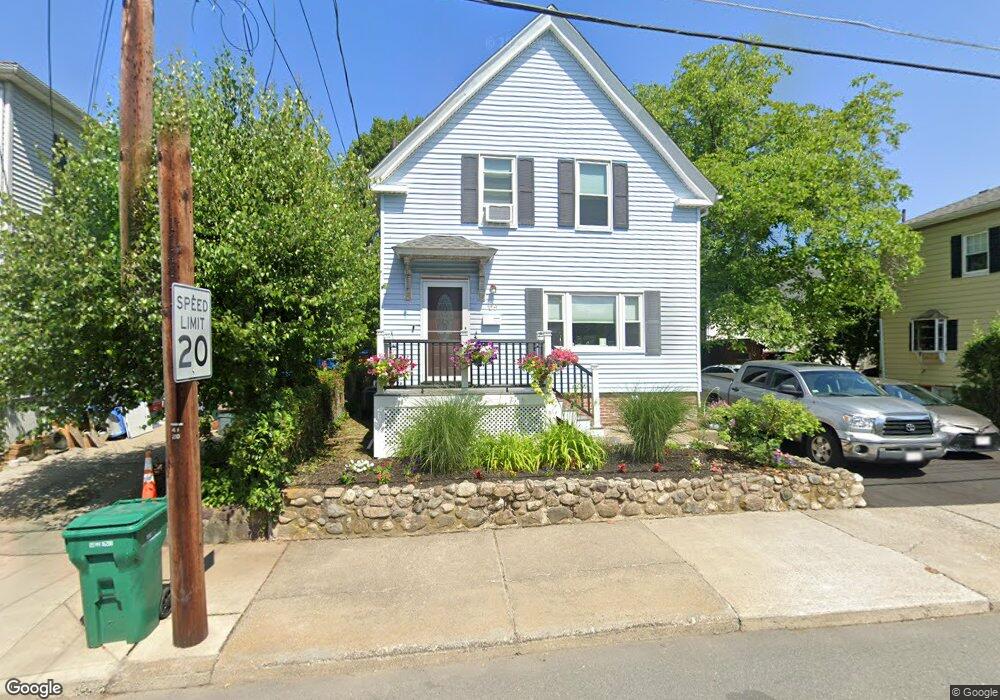
69 Wyman St Lynn, MA 01905
Lower Boston Street NeighborhoodEstimated Value: $552,000 - $602,128
3
Beds
2
Baths
1,232
Sq Ft
$473/Sq Ft
Est. Value
About This Home
This home is located at 69 Wyman St, Lynn, MA 01905 and is currently estimated at $582,782, approximately $473 per square foot. 69 Wyman St is a home located in Essex County with nearby schools including North Park Elementary School, Lincoln-Thomson Elementary School, and William R. Fallon School.
Ownership History
Date
Name
Owned For
Owner Type
Purchase Details
Closed on
Aug 28, 2002
Sold by
Karvelas Ilias and Karvelas Stavrula
Bought by
Creamer Steven E and Creamer Jeanan
Current Estimated Value
Purchase Details
Closed on
Feb 21, 1989
Sold by
Patten Leroy
Bought by
Karvelas Ilias
Create a Home Valuation Report for This Property
The Home Valuation Report is an in-depth analysis detailing your home's value as well as a comparison with similar homes in the area
Home Values in the Area
Average Home Value in this Area
Purchase History
| Date | Buyer | Sale Price | Title Company |
|---|---|---|---|
| Creamer Steven E | $245,000 | -- | |
| Creamer Steven E | $245,000 | -- | |
| Karvelas Ilias | $105,000 | -- | |
| Karvelas Ilias | $105,000 | -- |
Source: Public Records
Mortgage History
| Date | Status | Borrower | Loan Amount |
|---|---|---|---|
| Open | Karvelas Ilias | $15,000 | |
| Open | Karvelas Ilias | $196,500 |
Source: Public Records
Tax History Compared to Growth
Tax History
| Year | Tax Paid | Tax Assessment Tax Assessment Total Assessment is a certain percentage of the fair market value that is determined by local assessors to be the total taxable value of land and additions on the property. | Land | Improvement |
|---|---|---|---|---|
| 2025 | $5,839 | $563,600 | $226,600 | $337,000 |
| 2024 | $5,440 | $516,600 | $199,100 | $317,500 |
| 2023 | $5,383 | $482,800 | $205,600 | $277,200 |
| 2022 | $4,960 | $399,000 | $152,300 | $246,700 |
| 2021 | $4,817 | $369,700 | $140,000 | $229,700 |
| 2020 | $4,635 | $345,900 | $134,800 | $211,100 |
| 2019 | $4,650 | $325,200 | $126,900 | $198,300 |
| 2018 | $4,618 | $304,800 | $140,000 | $164,800 |
| 2017 | $4,223 | $270,700 | $116,400 | $154,300 |
| 2016 | $4,115 | $254,300 | $108,900 | $145,400 |
| 2015 | $3,926 | $234,400 | $108,100 | $126,300 |
Source: Public Records
Map
Nearby Homes