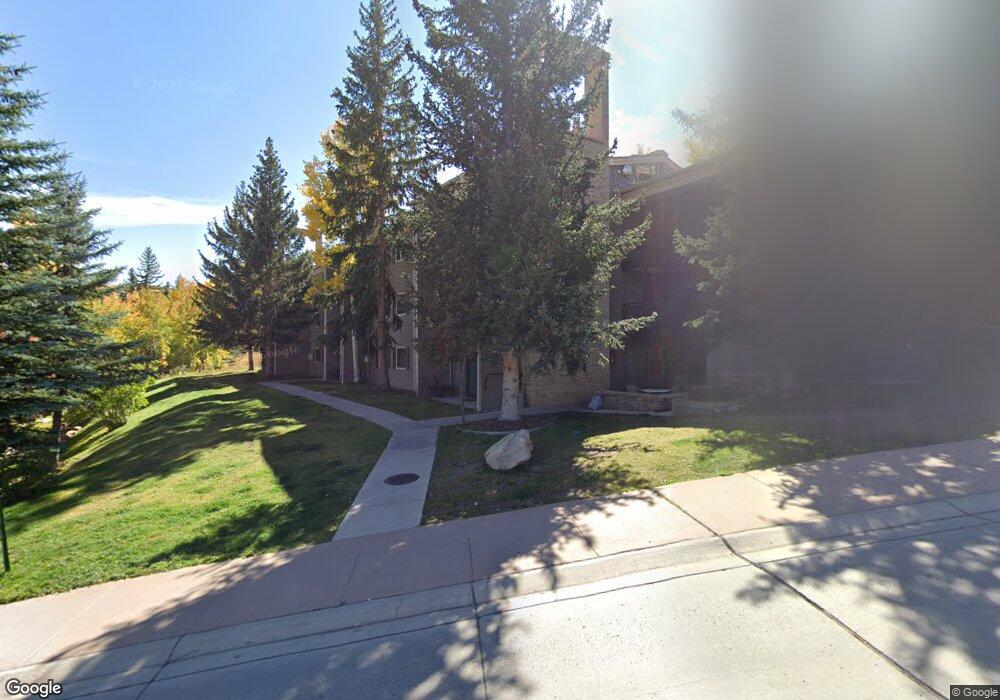
690 Carriage Way Unit C-2-B Snowmass Village, CO 81615
Estimated Value: $921,729 - $1,072,000
1
Bed
1
Bath
692
Sq Ft
$1,417/Sq Ft
Est. Value
About This Home
This home is located at 690 Carriage Way Unit C-2-B, Snowmass Village, CO 81615 and is currently estimated at $980,682, approximately $1,417 per square foot. 690 Carriage Way Unit C-2-B is a home located in Pitkin County with nearby schools including Aspen Elementary School, Aspen Middle School, and Aspen High School.
Ownership History
Date
Name
Owned For
Owner Type
Purchase Details
Closed on
Jun 27, 2019
Sold by
Hunter Stephen G and Hunter Anne D
Bought by
Anne D Hunter Trust
Current Estimated Value
Purchase Details
Closed on
Oct 3, 2007
Sold by
Hankinson Laurie
Bought by
Hunter Stephen G and Hunter Anne D
Home Financials for this Owner
Home Financials are based on the most recent Mortgage that was taken out on this home.
Original Mortgage
$417,000
Outstanding Balance
$264,948
Interest Rate
6.55%
Mortgage Type
Purchase Money Mortgage
Estimated Equity
$715,734
Purchase Details
Closed on
Aug 16, 2006
Sold by
Hankinson Ray and Hankinson Raymond
Bought by
Hankinson Laurie
Purchase Details
Closed on
Mar 16, 2005
Sold by
Amernick Marvin and Lucaric Margie
Bought by
Hankinson Ray and Hankinson Laurie
Home Financials for this Owner
Home Financials are based on the most recent Mortgage that was taken out on this home.
Original Mortgage
$280,000
Interest Rate
5.66%
Mortgage Type
Purchase Money Mortgage
Create a Home Valuation Report for This Property
The Home Valuation Report is an in-depth analysis detailing your home's value as well as a comparison with similar homes in the area
Home Values in the Area
Average Home Value in this Area
Purchase History
| Date | Buyer | Sale Price | Title Company |
|---|---|---|---|
| Anne D Hunter Trust | -- | None Available | |
| Hunter Stephen G | $532,000 | None Available | |
| Hankinson Laurie | -- | None Available | |
| Hankinson Ray | $380,000 | -- |
Source: Public Records
Mortgage History
| Date | Status | Borrower | Loan Amount |
|---|---|---|---|
| Open | Hunter Stephen G | $417,000 | |
| Previous Owner | Hankinson Ray | $280,000 |
Source: Public Records
Tax History Compared to Growth
Tax History
| Year | Tax Paid | Tax Assessment Tax Assessment Total Assessment is a certain percentage of the fair market value that is determined by local assessors to be the total taxable value of land and additions on the property. | Land | Improvement |
|---|---|---|---|---|
| 2024 | $2,112 | $47,030 | $0 | $47,030 |
| 2023 | $2,112 | $50,200 | $0 | $50,200 |
| 2022 | $1,412 | $27,740 | $0 | $27,740 |
| 2021 | $1,436 | $28,540 | $0 | $28,540 |
| 2020 | $1,421 | $27,990 | $0 | $27,990 |
| 2019 | $1,421 | $27,990 | $0 | $27,990 |
| 2018 | $1,416 | $28,190 | $0 | $28,190 |
| 2017 | $1,350 | $27,290 | $0 | $27,290 |
| 2016 | $1,459 | $29,560 | $0 | $29,560 |
| 2015 | $1,308 | $29,560 | $0 | $29,560 |
| 2014 | $1,427 | $31,930 | $0 | $31,930 |
Source: Public Records
Map
Nearby Homes
- 855 Carriage Way Unit Trails 103
- 855 Carriage Way Unit Summit 202
- 690 Carriage Way Unit B2G
- 600 Carriage Way Unit K9&10
- 600 Carriage Way Unit Ka
- 473 Creek Ln
- TBD Daly Ln
- 660 Brush Creek Rd
- 61 Trails End Ln Unit 2
- 35 Campground Ln Unit E-4
- 65 Campground Ln Unit 94
- 105 Campground Ln Unit 502
- 198 Edgewood Ln
- 300 Carriage Way Unit 623
- 300 Carriage Way Unit 303
- 300 Carriage Way Unit 506
- 411 Wood Rd Unit 10
- 411 Wood Rd Unit 8
- 425 Wood Rd Unit 19
- 425 Wood Rd Unit 10
- 690 Carriage Way Unit A3F
- 690 Carriage Way Unit B1B
- 690 Carriage Way Unit C3A
- 690 Carriage Way Unit C1A
- 690 Carriage Way Unit B-2g
- 690 Carriage Way Unit Timberline 3f
- 690 Carriage Way Unit 306
- 690 Carriage Way Unit A-3D
- 690 Carriage Way Unit 218
- 690 Carriage Way Unit B 3a
- 690 Carriage Way Unit D1b
- 690 Carriage Way Unit D2f
- 690 Carriage Way Unit C3d
- 690 Carriage Way Unit 117
- 690 Carriage Way Unit C1B
- 690 Carriage Way Unit Bldg B, Unit 2G
- 690 Carriage Way Unit A2F
- 690 Carriage Way Unit B1B
- 690 Carriage Way Unit Timberline D2F
- 690 Carriage Way Unit C3G