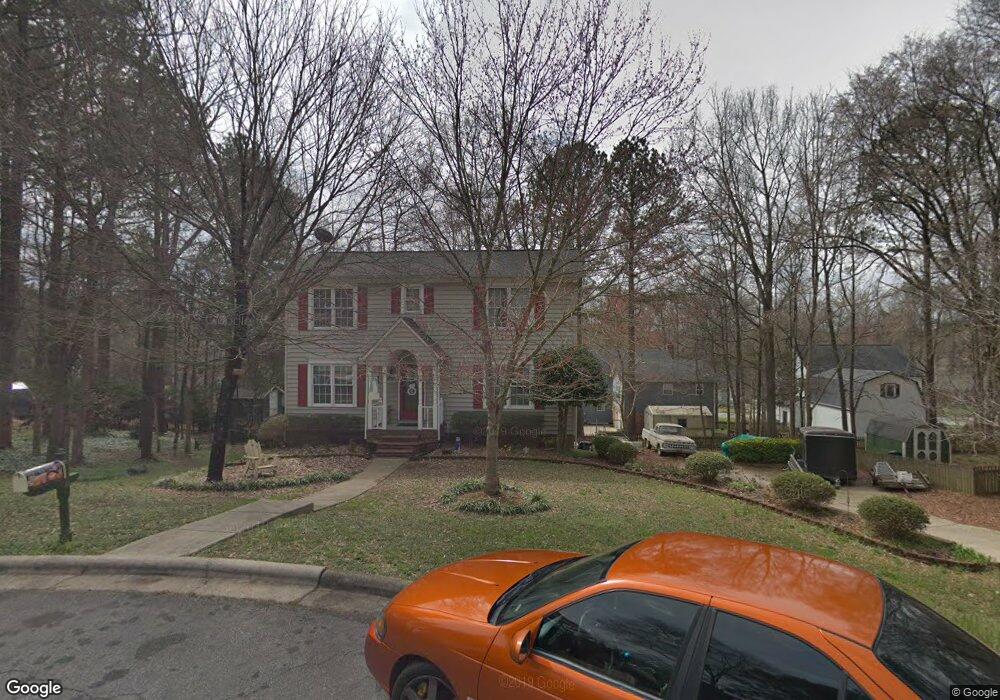
690 Crab Tree Ct SW Concord, NC 28025
Estimated Value: $352,299 - $379,000
3
Beds
3
Baths
1,728
Sq Ft
$209/Sq Ft
Est. Value
About This Home
This home is located at 690 Crab Tree Ct SW, Concord, NC 28025 and is currently estimated at $361,575, approximately $209 per square foot. 690 Crab Tree Ct SW is a home located in Cabarrus County with nearby schools including R Brown Mcallister STEMElementary, Concord Middle School, and Concord High School.
Ownership History
Date
Name
Owned For
Owner Type
Purchase Details
Closed on
Aug 11, 2000
Sold by
Goss Glenn A and Goss Susan H
Bought by
Newell J Scott and Newell Laurie M
Current Estimated Value
Home Financials for this Owner
Home Financials are based on the most recent Mortgage that was taken out on this home.
Original Mortgage
$96,900
Outstanding Balance
$35,184
Interest Rate
8.24%
Estimated Equity
$326,391
Purchase Details
Closed on
Dec 1, 1993
Create a Home Valuation Report for This Property
The Home Valuation Report is an in-depth analysis detailing your home's value as well as a comparison with similar homes in the area
Home Values in the Area
Average Home Value in this Area
Purchase History
| Date | Buyer | Sale Price | Title Company |
|---|---|---|---|
| Newell J Scott | $143,000 | -- | |
| -- | $122,000 | -- |
Source: Public Records
Mortgage History
| Date | Status | Borrower | Loan Amount |
|---|---|---|---|
| Open | Newell J Scott | $96,900 |
Source: Public Records
Tax History Compared to Growth
Tax History
| Year | Tax Paid | Tax Assessment Tax Assessment Total Assessment is a certain percentage of the fair market value that is determined by local assessors to be the total taxable value of land and additions on the property. | Land | Improvement |
|---|---|---|---|---|
| 2025 | $3,116 | $312,870 | $78,000 | $234,870 |
| 2024 | $3,116 | $312,870 | $78,000 | $234,870 |
| 2023 | $2,203 | $180,570 | $40,000 | $140,570 |
| 2022 | $2,203 | $180,570 | $40,000 | $140,570 |
| 2021 | $2,203 | $180,570 | $40,000 | $140,570 |
| 2020 | $2,203 | $180,570 | $40,000 | $140,570 |
| 2019 | $1,923 | $157,660 | $36,000 | $121,660 |
| 2018 | $1,892 | $157,660 | $36,000 | $121,660 |
| 2017 | $1,860 | $157,660 | $36,000 | $121,660 |
| 2016 | $1,104 | $152,180 | $36,000 | $116,180 |
| 2015 | $1,796 | $152,180 | $36,000 | $116,180 |
| 2014 | $1,796 | $152,180 | $36,000 | $116,180 |
Source: Public Records
Map
Nearby Homes
- 269 Fryling Ave SW
- 309 Brightwood Ct SW
- 671 Sedgefield St SW
- 159 Fryling Ave SW
- 80 Pounds Ave SW
- 736 Spring St SW
- 111 Wilshire Ave SW
- 782 Union St S
- 783 Union St S
- 358 Cozart Ave SW
- 569 Union St S
- 571 Union St S
- 24 Doris Ct SE
- 34 Rollingwood Dr SE
- 23 Lawndale Ave SE
- 85 Myrtle Ave SW
- 00 Rollingwood Ln
- 66 Arlington Ave SE
- 336 Lincoln St SW
- 229 Boger Ct SW
- 280 Fryling Ave SW
- 692 Crab Tree Ct SW
- 688 Crab Tree Ct SW
- 278 Fryling Ave SW
- 282 Fryling Ave SW
- 276 Fryling Ave SW
- 691 Crab Tree Ct SW
- 689 Crab Tree Ct SW
- 274 Fryling Ave SW
- 272 Fryling Ave SW
- 687 Crab Tree Ct SW
- 270 Fryling Ave SW
- 268 Fryling Ave SW
- 270 Lemon Tree Ln SW
- 692 Journey St SW
- 694 Journey St SW
- 268 Lemon Tree Ln SW
- 272 Lemon Tree Ln SW
- 690 Journey St SW
- 283 Fryling Ave SW