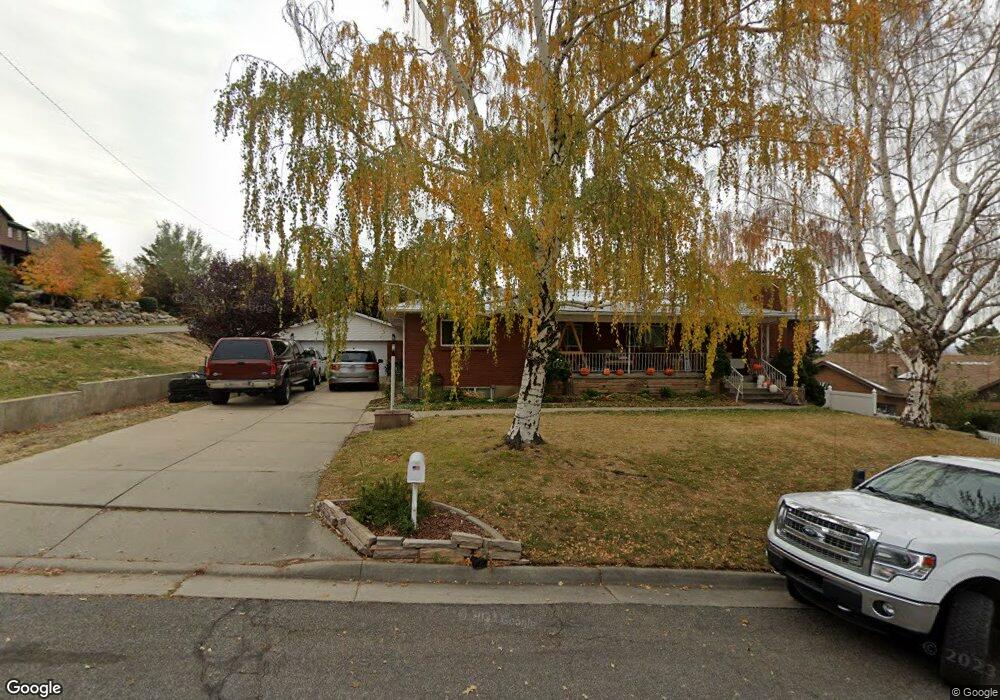
690 E 100 N Centerville, UT 84014
Estimated Value: $586,000 - $653,078
5
Beds
3
Baths
3,406
Sq Ft
$180/Sq Ft
Est. Value
About This Home
This home is located at 690 E 100 N, Centerville, UT 84014 and is currently estimated at $614,770, approximately $180 per square foot. 690 E 100 N is a home located in Davis County with nearby schools including Centerville Elementary, Centerville Jr High, and Viewmont High School.
Ownership History
Date
Name
Owned For
Owner Type
Purchase Details
Closed on
Dec 21, 2021
Sold by
Hpa Jv Borrower 2019 1 Ml Llc
Bought by
Peck Brian and Peck Jessica
Current Estimated Value
Home Financials for this Owner
Home Financials are based on the most recent Mortgage that was taken out on this home.
Original Mortgage
$22,750
Outstanding Balance
$20,884
Interest Rate
3.12%
Estimated Equity
$593,886
Purchase Details
Closed on
Jan 29, 2019
Sold by
Hp Utah I Llc
Bought by
Hpa Jv Borrower 2019 1 Ml Llc
Home Financials for this Owner
Home Financials are based on the most recent Mortgage that was taken out on this home.
Original Mortgage
$200,000,000
Interest Rate
4.6%
Mortgage Type
Commercial
Purchase Details
Closed on
Aug 27, 2018
Sold by
Montgomery Eileen and Wilde Elaine P
Bought by
Hp Utah I Llc
Create a Home Valuation Report for This Property
The Home Valuation Report is an in-depth analysis detailing your home's value as well as a comparison with similar homes in the area
Purchase History
| Date | Buyer | Sale Price | Title Company |
|---|---|---|---|
| Peck Brian | -- | Metro National Title | |
| Hpa Jv Borrower 2019 1 Ml Llc | -- | Stewart Title Inc Ag | |
| Hp Utah I Llc | -- | Stewart Title |
Source: Public Records
Mortgage History
| Date | Status | Borrower | Loan Amount |
|---|---|---|---|
| Open | Peck Brian | $22,750 | |
| Open | Peck Brian | $413,571 | |
| Previous Owner | Hpa Jv Borrower 2019 1 Ml Llc | $200,000,000 |
Source: Public Records
Tax History
| Year | Tax Paid | Tax Assessment Tax Assessment Total Assessment is a certain percentage of the fair market value that is determined by local assessors to be the total taxable value of land and additions on the property. | Land | Improvement |
|---|---|---|---|---|
| 2025 | $3,579 | $324,500 | $170,578 | $153,922 |
| 2024 | $3,387 | $314,050 | $157,214 | $156,836 |
| 2023 | $3,239 | $545,000 | $252,758 | $292,242 |
| 2022 | $3,312 | $320,650 | $128,667 | $191,983 |
| 2021 | $5,438 | $451,000 | $202,244 | $248,756 |
| 2020 | $2,481 | $374,000 | $194,568 | $179,432 |
| 2019 | $2,533 | $373,000 | $185,351 | $187,649 |
| 2018 | $2,365 | $344,000 | $180,141 | $163,859 |
| 2016 | $437 | $163,130 | $66,355 | $96,775 |
| 2015 | $1,981 | $151,085 | $66,355 | $84,730 |
| 2014 | $411 | $150,102 | $66,355 | $83,747 |
| 2013 | -- | $132,887 | $51,768 | $81,119 |
Source: Public Records
Map
Nearby Homes
Your Personal Tour Guide
Ask me questions while you tour the home.