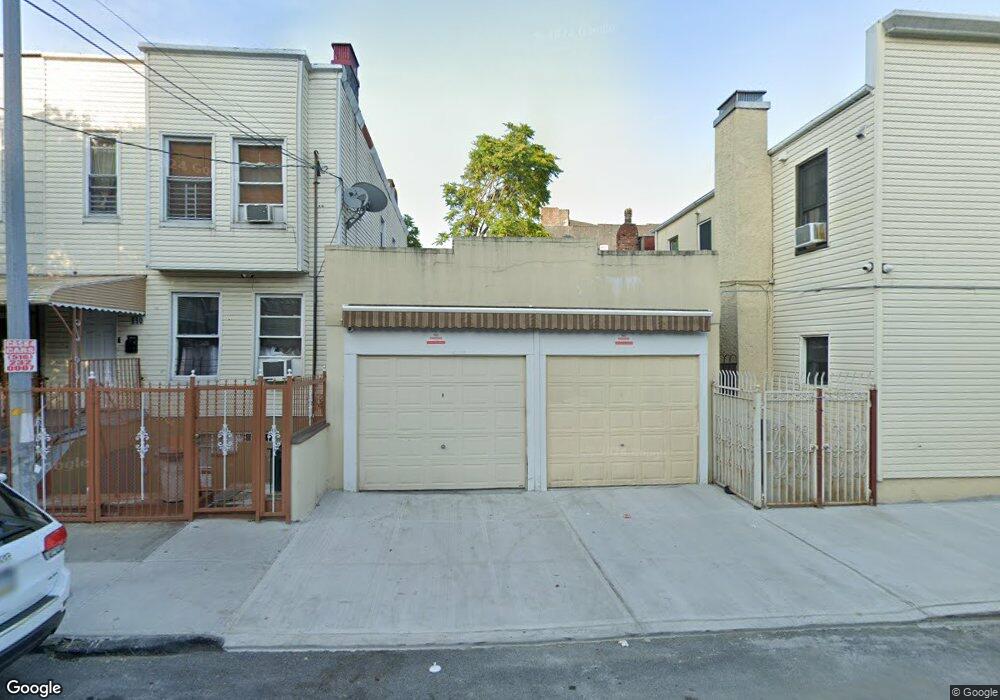
690 E 188th St Bronx, NY 10458
Belmont NeighborhoodEstimated Value: $511,532 - $1,113,000
Studio
--
Bath
1,520
Sq Ft
$547/Sq Ft
Est. Value
About This Home
This home is located at 690 E 188th St, Bronx, NY 10458 and is currently estimated at $831,383, approximately $546 per square foot. 690 E 188th St is a home located in Bronx County with nearby schools including P.S. 205 Fiorello LaGuardia, Thomas C Giordano Middleschool 45, and Cardinal McCloskey Community Charter School.
Ownership History
Date
Name
Owned For
Owner Type
Purchase Details
Closed on
Dec 4, 2003
Sold by
Superior Development Corp
Bought by
Pineda Aury
Current Estimated Value
Home Financials for this Owner
Home Financials are based on the most recent Mortgage that was taken out on this home.
Original Mortgage
$354,438
Interest Rate
5.86%
Mortgage Type
Purchase Money Mortgage
Purchase Details
Closed on
Jul 22, 2003
Sold by
Paladino Gloria and Paladino Louis
Bought by
Superior Development Corp
Purchase Details
Closed on
Feb 24, 1999
Sold by
Warnock Capital Corp
Bought by
Valcarcel Mark and Paladino Louis
Home Financials for this Owner
Home Financials are based on the most recent Mortgage that was taken out on this home.
Original Mortgage
$168,405
Interest Rate
6.95%
Mortgage Type
FHA
Purchase Details
Closed on
Feb 9, 1998
Sold by
Difuccia Ralph
Bought by
Home Buyers Of New York
Create a Home Valuation Report for This Property
The Home Valuation Report is an in-depth analysis detailing your home's value as well as a comparison with similar homes in the area
Home Values in the Area
Average Home Value in this Area
Purchase History
| Date | Buyer | Sale Price | Title Company |
|---|---|---|---|
| Pineda Aury | $360,000 | -- | |
| Superior Development Corp | $225,000 | -- | |
| Valcarcel Mark | $169,000 | Fidelity National Title Ins | |
| Home Buyers Of New York | $105,000 | Commonwealth Land Title Ins |
Source: Public Records
Mortgage History
| Date | Status | Borrower | Loan Amount |
|---|---|---|---|
| Previous Owner | Pineda Aury | $354,438 | |
| Previous Owner | Valcarcel Mark | $168,405 |
Source: Public Records
Tax History
| Year | Tax Paid | Tax Assessment Tax Assessment Total Assessment is a certain percentage of the fair market value that is determined by local assessors to be the total taxable value of land and additions on the property. | Land | Improvement |
|---|---|---|---|---|
| 2025 | $3,842 | $20,275 | $3,698 | $16,577 |
| 2024 | $3,842 | $19,130 | $3,161 | $15,969 |
| 2023 | $3,667 | $18,054 | $3,445 | $14,609 |
| 2022 | $3,604 | $30,660 | $6,960 | $23,700 |
| 2021 | $3,588 | $32,220 | $6,960 | $25,260 |
| 2020 | $3,576 | $35,580 | $6,960 | $28,620 |
| 2019 | $3,335 | $28,860 | $6,960 | $21,900 |
| 2018 | $3,067 | $15,045 | $3,100 | $11,945 |
| 2017 | $3,067 | $15,045 | $3,769 | $11,276 |
| 2016 | $2,840 | $14,209 | $4,805 | $9,404 |
| 2015 | $1,712 | $14,080 | $6,105 | $7,975 |
| 2014 | $1,712 | $13,285 | $5,138 | $8,147 |
Source: Public Records
Map
Nearby Homes
- 2471 Crotona Ave
- 2420 Cambreleng Ave
- 2445 Southern Blvd
- 2459 Hoffman St Unit 2461
- 2469 Hoffman St
- 45-44 E 189th St
- 554 E 191st St Unit 1,2,3
- 2249 Hughes Ave
- 620 E 182nd St
- 2158 Hughes Ave
- 2304 Bassford Ave
- 505 E 183rd St
- 805 E 182nd St Unit 4E
- 506 E 183rd St
- - - E 183rd Street & Bassford Ave
- 2135 Crotona Ave Unit 2B
- 2255 Bathgate Ave
- 2259 Bassford Ave
- 446 E 186th St
- 2249 Bassford Ave
- 692 E 188th St
- 2426 Cambreleng Ave
- 2428 Cambreleng Ave
- 2424 Cambreleng Ave
- 2430 Cambreleng Ave Unit 2432
- 2430-2432 Cambreleng Ave
- 2422 Cambreleng Ave
- 2421 Beaumont Ave
- 2420 N Cambreleng Ave
- 2419 Beaumont Ave
- 2423 Beaumont Ave
- 2417 Beaumont Ave
- 2418 Cambreleng Ave
- 2415 Beaumont Ave
- 2413 Beaumont Ave
- 2434 Cambreleng Ave
- 2414 Cambreleng Ave
- 2436 Cambreleng Ave
- 2436 Cambreleng Ave Unit 1
- 2436 Cambreleng Ave Unit 2
Your Personal Tour Guide
Ask me questions while you tour the home.