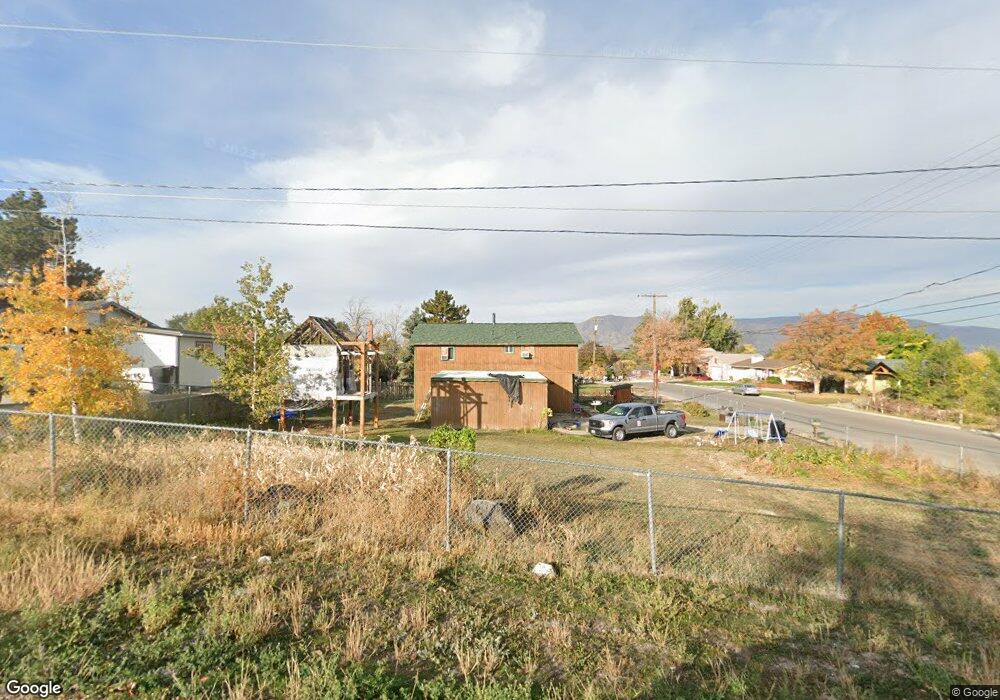
690 E 400 S Payson, UT 84651
Estimated Value: $409,166 - $454,000
4
Beds
2
Baths
1,643
Sq Ft
$261/Sq Ft
Est. Value
About This Home
This home is located at 690 E 400 S, Payson, UT 84651 and is currently estimated at $428,722, approximately $260 per square foot. 690 E 400 S is a home located in Utah County with nearby schools including Barnett Elementary School, Salem Junior High School, and Valley View Middle School.
Ownership History
Date
Name
Owned For
Owner Type
Purchase Details
Closed on
Mar 10, 2006
Sold by
Gardner Phoebe A
Bought by
Oler Daniel T and Oler Joanie
Current Estimated Value
Home Financials for this Owner
Home Financials are based on the most recent Mortgage that was taken out on this home.
Original Mortgage
$144,728
Outstanding Balance
$81,891
Interest Rate
6.19%
Mortgage Type
FHA
Estimated Equity
$346,831
Purchase Details
Closed on
Jun 16, 2004
Sold by
Gardner Phoebe
Bought by
Wilford N Hansen Jr Attorney P C
Purchase Details
Closed on
Apr 6, 2004
Sold by
Gardner Phoebe
Bought by
Wilford N Hansen Jr Attorney Pc
Purchase Details
Closed on
Oct 22, 1998
Sold by
Gardner Dean L
Bought by
Gardner Phoebe A
Home Financials for this Owner
Home Financials are based on the most recent Mortgage that was taken out on this home.
Original Mortgage
$50,000
Interest Rate
6.71%
Create a Home Valuation Report for This Property
The Home Valuation Report is an in-depth analysis detailing your home's value as well as a comparison with similar homes in the area
Home Values in the Area
Average Home Value in this Area
Purchase History
| Date | Buyer | Sale Price | Title Company |
|---|---|---|---|
| Oler Daniel T | -- | Provo Land Title Company | |
| Wilford N Hansen Jr Attorney P C | $9,640 | -- | |
| Wilford N Hansen Jr Attorney Pc | $9,200 | -- | |
| Gardner Phoebe A | -- | -- |
Source: Public Records
Mortgage History
| Date | Status | Borrower | Loan Amount |
|---|---|---|---|
| Open | Oler Daniel T | $144,728 | |
| Previous Owner | Gardner Phoebe A | $50,000 |
Source: Public Records
Tax History
| Year | Tax Paid | Tax Assessment Tax Assessment Total Assessment is a certain percentage of the fair market value that is determined by local assessors to be the total taxable value of land and additions on the property. | Land | Improvement |
|---|---|---|---|---|
| 2025 | $1,850 | $195,690 | -- | -- |
| 2024 | $1,850 | $188,320 | $0 | $0 |
| 2023 | $1,887 | $192,555 | $0 | $0 |
| 2022 | $1,850 | $185,680 | $0 | $0 |
| 2021 | $1,541 | $248,000 | $85,800 | $162,200 |
| 2020 | $1,469 | $231,300 | $78,000 | $153,300 |
| 2019 | $1,248 | $201,500 | $67,400 | $134,100 |
| 2018 | $1,114 | $173,400 | $56,800 | $116,600 |
| 2017 | $1,025 | $85,800 | $0 | $0 |
| 2016 | $912 | $75,845 | $0 | $0 |
| 2015 | $819 | $67,650 | $0 | $0 |
| 2014 | $736 | $61,215 | $0 | $0 |
Source: Public Records
Map
Nearby Homes
- 551 E 500 S
- 862 E 200 S
- 412 S Goosenest Dr
- 426 S Goosenest Dr
- 252 S 400 E
- 420 E 600 S
- 977 E 100 S
- 981 E 100 S
- 1836 S 100 E
- 1058 E 100 N
- 346 Jay Ln
- 252 E 670 S Unit 2
- 229 E 670 S Unit 7
- 228 E Utah Ave
- 116 E 100 S
- 873 E 200 N
- 1287 N 1390 E Unit 25-96
- 549 S Main St
- 753 N Emery Ln Unit 57
- 678 N Mountain View Dr
Your Personal Tour Guide
Ask me questions while you tour the home.