Estimated Value: $269,094 - $352,000
6
Beds
1
Bath
3,128
Sq Ft
$100/Sq Ft
Est. Value
About This Home
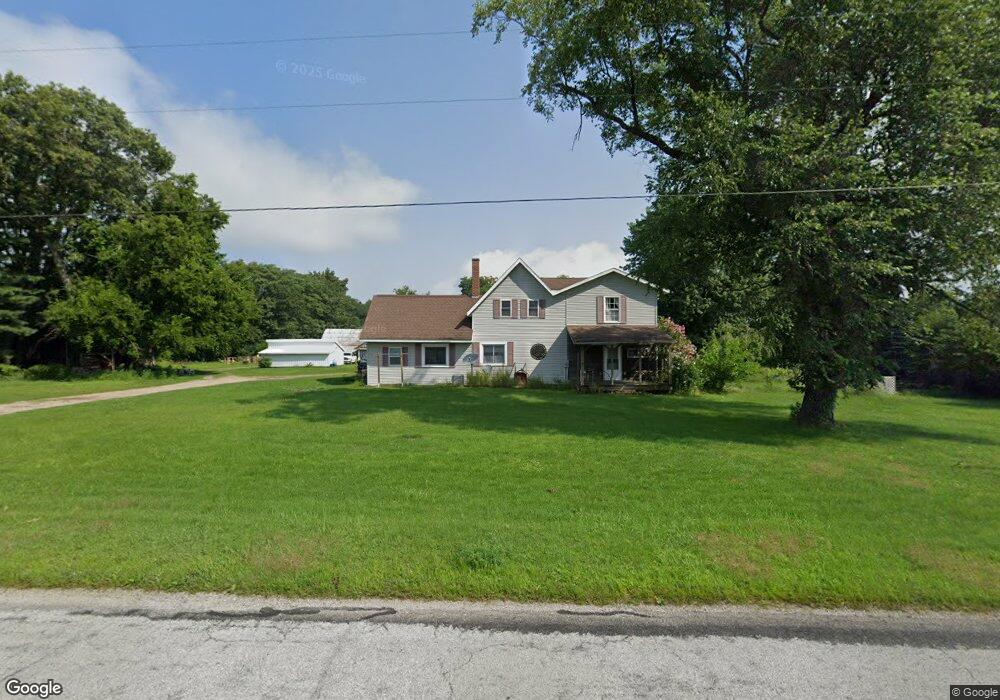
This home is located at 690 E Toto Rd, Knox, IN 46534 and is currently estimated at $311,365, approximately $99 per square foot. 690 E Toto Rd is a home located in Starke County with nearby schools including Knox Community Elementary School, Knox Community Middle School, and Knox Community High School.
Ownership History
Date
Name
Owned For
Owner Type
Purchase Details
Closed on
Apr 28, 2020
Sold by
White Russell
Bought by
Bartoli Daniel and Bartoli Shendell
Current Estimated Value
Purchase Details
Closed on
Jul 11, 2014
Sold by
White Dawn E
Bought by
White Russell C
Home Financials for this Owner
Home Financials are based on the most recent Mortgage that was taken out on this home.
Original Mortgage
$93,315
Interest Rate
4.12%
Mortgage Type
Purchase Money Mortgage
Create a Home Valuation Report for This Property
The Home Valuation Report is an in-depth analysis detailing your home's value as well as a comparison with similar homes in the area
Purchase History
| Date | Buyer | Sale Price | Title Company |
|---|---|---|---|
| Bartoli Daniel | -- | None Available | |
| White Russell C | -- | None Available |
Source: Public Records
Mortgage History
| Date | Status | Borrower | Loan Amount |
|---|---|---|---|
| Previous Owner | White Russell C | $93,315 |
Source: Public Records
Tax History
| Year | Tax Paid | Tax Assessment Tax Assessment Total Assessment is a certain percentage of the fair market value that is determined by local assessors to be the total taxable value of land and additions on the property. | Land | Improvement |
|---|---|---|---|---|
| 2025 | $1,722 | $245,700 | $62,900 | $182,800 |
| 2024 | $1,722 | $221,900 | $60,200 | $161,700 |
| 2023 | $1,622 | $196,400 | $50,200 | $146,200 |
| 2022 | $1,528 | $174,600 | $44,900 | $129,700 |
| 2021 | $1,379 | $149,100 | $40,800 | $108,300 |
| 2020 | $1,149 | $125,200 | $29,000 | $96,200 |
| 2019 | $1,146 | $121,000 | $31,600 | $89,400 |
| 2018 | $1,100 | $118,900 | $32,100 | $86,800 |
| 2017 | $978 | $114,000 | $34,400 | $79,600 |
| 2016 | $1,015 | $113,900 | $35,500 | $78,400 |
| 2014 | $903 | $116,300 | $37,000 | $79,300 |
| 2013 | $816 | $112,900 | $34,200 | $78,700 |
Source: Public Records
Map
Nearby Homes
- 2760 S Lovelia Dr
- 2075 E 200 S
- 840 W 450 S
- 0 E 500 S
- 3360 S State Road 39
- 1892 W 200 S
- 4540 S 300 E
- 2240 S 350 E
- 1301 W Culver Rd
- 1309 S Roosevelt Rd
- 3395 U S 35
- 2455 W Impala St
- 14.89 Acres W Culver Rd
- 2260 S Us Highway 35
- 903 S Portland St
- 4189 E County Road 200 S
- 701 S Shield St
- 305 W New York St
- 4395 E 200 S
- 703 S Main St
Your Personal Tour Guide
Ask me questions while you tour the home.