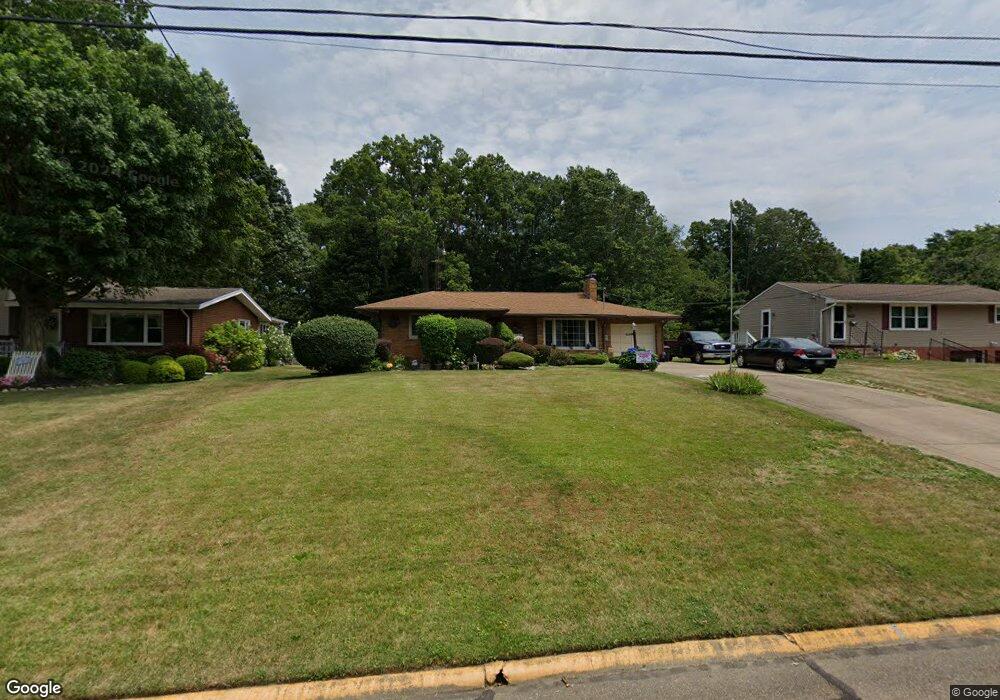
690 Fernwood Blvd Alliance, OH 44601
Estimated Value: $207,367 - $287,000
3
Beds
2
Baths
1,540
Sq Ft
$156/Sq Ft
Est. Value
About This Home
This home is located at 690 Fernwood Blvd, Alliance, OH 44601 and is currently estimated at $239,842, approximately $155 per square foot. 690 Fernwood Blvd is a home located in Stark County with nearby schools including Alliance Early Learning School, Alliance Intermediate School at Northside, and Alliance Middle School.
Ownership History
Date
Name
Owned For
Owner Type
Purchase Details
Closed on
Dec 5, 2011
Sold by
Billheimer Sheila J and Dickerhoff Allan E
Bought by
Miller Mark A and Menges Amber R
Current Estimated Value
Purchase Details
Closed on
Jan 31, 2008
Sold by
Dickerhoff Mabel A
Bought by
Billheimer Sheila J and Dickerhoff Allan E
Create a Home Valuation Report for This Property
The Home Valuation Report is an in-depth analysis detailing your home's value as well as a comparison with similar homes in the area
Home Values in the Area
Average Home Value in this Area
Purchase History
| Date | Buyer | Sale Price | Title Company |
|---|---|---|---|
| Miller Mark A | $120,000 | Attorney | |
| Billheimer Sheila J | -- | None Available |
Source: Public Records
Tax History Compared to Growth
Tax History
| Year | Tax Paid | Tax Assessment Tax Assessment Total Assessment is a certain percentage of the fair market value that is determined by local assessors to be the total taxable value of land and additions on the property. | Land | Improvement |
|---|---|---|---|---|
| 2025 | $2,515 | $60,340 | $12,040 | $48,300 |
| 2024 | $4,620 | $60,340 | $12,040 | $48,300 |
| 2023 | $4,500 | $46,660 | $9,170 | $37,490 |
| 2022 | $1,888 | $46,660 | $9,170 | $37,490 |
| 2021 | $1,889 | $46,660 | $9,170 | $37,490 |
| 2020 | $1,713 | $39,520 | $7,980 | $31,540 |
| 2019 | $1,689 | $39,520 | $7,980 | $31,540 |
| 2018 | $1,697 | $39,520 | $7,980 | $31,540 |
| 2017 | $1,688 | $38,680 | $6,690 | $31,990 |
| 2016 | $1,774 | $40,320 | $8,330 | $31,990 |
| 2015 | $1,790 | $40,320 | $8,330 | $31,990 |
| 2014 | $1,748 | $37,490 | $7,740 | $29,750 |
| 2013 | $872 | $37,490 | $7,740 | $29,750 |
Source: Public Records
Map
Nearby Homes
- 1038 Fairview Place
- 734 Parkway Blvd
- 970 Kingsway St
- 896 Parkway Blvd
- 725 W Summit St
- 565 W Broadway St
- 738 Kingsway St
- 645 W Summit St
- 1201 Overlook Dr
- 1321 Parkway Blvd
- 345 W Market St
- 0 W Main St Unit 5090123
- 329 1/2 W Main St
- 1515 S Rockhill Ave
- 140 W Summit St
- 132 S Haines Ave
- 432 Johnson Ave
- 511 W Ely St
- 163 W Market St
- 884 W College Rd
- 680 Fernwood Blvd
- 710 Fernwood Blvd
- 660 Fernwood Blvd
- 720 Fernwood Blvd
- 740 Fernwood Blvd
- 711 Fairview Place
- 760 Fernwood Blvd
- 630 Fernwood Blvd
- 689 Fairview Place
- 804 Fernwood Blvd
- 671 Fairview Place
- 729 Fairview Place
- 1180 W Cambridge St
- 649 Fairview Place
- 812 Fernwood Blvd
- 757 Fairview Place
- 1130 W Cambridge St
- 633 Fairview Place
- 820 Fernwood Blvd
- 811 Fairview Place