Estimated Value: $275,000 - $302,000
2
Beds
3
Baths
1,388
Sq Ft
$208/Sq Ft
Est. Value
About This Home
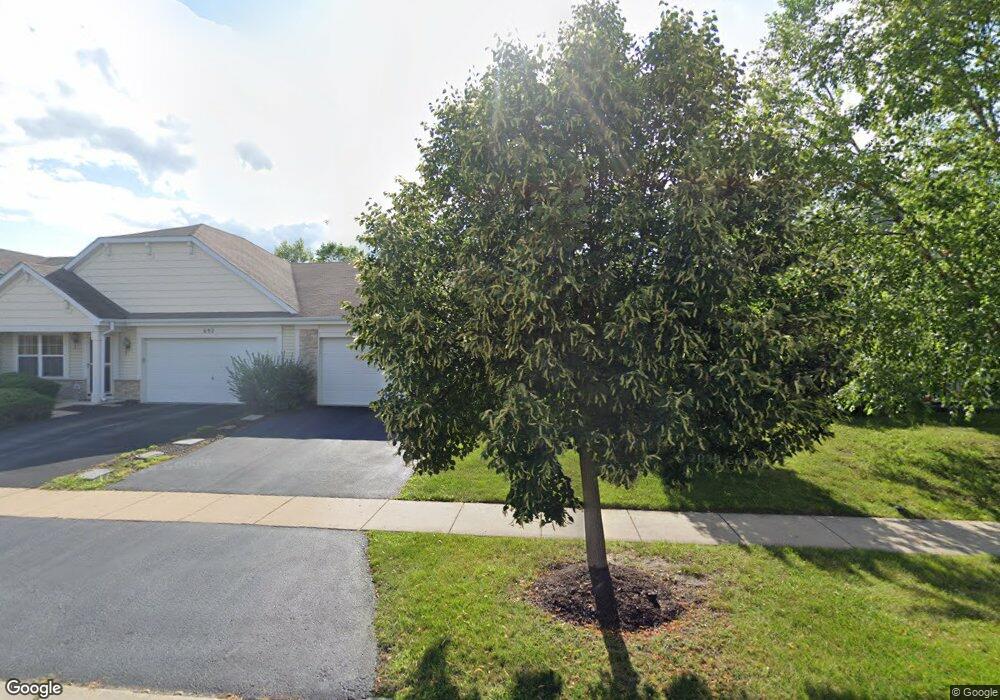
This home is located at 690 Harp Ave Unit 690, Volo, IL 60073 and is currently estimated at $288,581, approximately $207 per square foot. 690 Harp Ave Unit 690 is a home located in Lake County with nearby schools including Robert Crown School, Wauconda Middle School, and Wauconda High School.
Ownership History
Date
Name
Owned For
Owner Type
Purchase Details
Closed on
Nov 23, 2019
Sold by
Creaney Kim
Bought by
Creaney Kimberley A and Kimberley A Creaney Declaration Of Trust
Current Estimated Value
Purchase Details
Closed on
Nov 22, 2016
Sold by
Cornerstone National Bank & Trust Compan
Bought by
Creaney Kim
Home Financials for this Owner
Home Financials are based on the most recent Mortgage that was taken out on this home.
Original Mortgage
$50,000
Outstanding Balance
$23,071
Interest Rate
2.75%
Mortgage Type
New Conventional
Estimated Equity
$265,510
Purchase Details
Closed on
Jul 10, 2009
Sold by
Elizondo Trudy A
Bought by
Elizondo Trudy A and Trudy A Elizondo Declaration Of Living T
Purchase Details
Closed on
Aug 9, 2007
Sold by
Drh Cambridge Homes Inc
Bought by
Elizondo Trudy A
Home Financials for this Owner
Home Financials are based on the most recent Mortgage that was taken out on this home.
Original Mortgage
$142,880
Interest Rate
6.5%
Mortgage Type
Unknown
Create a Home Valuation Report for This Property
The Home Valuation Report is an in-depth analysis detailing your home's value as well as a comparison with similar homes in the area
Home Values in the Area
Average Home Value in this Area
Purchase History
| Date | Buyer | Sale Price | Title Company |
|---|---|---|---|
| Creaney Kimberley A | -- | Attorney | |
| Creaney Kim | $138,000 | Attorneys Title Guaranty Fun | |
| Elizondo Trudy A | -- | None Available | |
| Elizondo Trudy A | $201,000 | First American Title |
Source: Public Records
Mortgage History
| Date | Status | Borrower | Loan Amount |
|---|---|---|---|
| Open | Creaney Kim | $50,000 | |
| Previous Owner | Elizondo Trudy A | $142,880 |
Source: Public Records
Tax History
| Year | Tax Paid | Tax Assessment Tax Assessment Total Assessment is a certain percentage of the fair market value that is determined by local assessors to be the total taxable value of land and additions on the property. | Land | Improvement |
|---|---|---|---|---|
| 2024 | $6,034 | $69,414 | $6,940 | $62,474 |
| 2023 | $5,866 | $63,450 | $6,344 | $57,106 |
| 2022 | $5,866 | $54,162 | $6,055 | $48,107 |
| 2021 | $5,708 | $51,178 | $5,721 | $45,457 |
| 2020 | $5,582 | $48,778 | $5,453 | $43,325 |
| 2019 | $5,045 | $46,100 | $5,154 | $40,946 |
| 2018 | $5,599 | $47,911 | $7,196 | $40,715 |
| 2017 | $5,614 | $47,357 | $7,113 | $40,244 |
| 2016 | $6,013 | $44,846 | $6,736 | $38,110 |
| 2015 | $4,675 | $41,170 | $6,184 | $34,986 |
| 2014 | $4,598 | $40,999 | $7,160 | $33,839 |
| 2012 | $3,767 | $41,738 | $7,289 | $34,449 |
Source: Public Records
Map
Nearby Homes
- 605 Treble Ln
- 593 Treble Ln
- 569 Treble Ln
- 534 Richard Brown Blvd
- 683 Niagara Dr
- 26222 Illinois 120
- 1085 Adagio Dr
- 202 Minuet Cir
- 26222 W Belvidere Rd
- 1147 Piccolo Ln
- 25651 Illinois 60
- 27065-9 Illinois 120
- 30918 N US Highway 12
- 30351 N Us Highway 12
- 28200 W Il Route 120
- 32865 N Us Highway 12
- 2840 Cattail Ct Unit F
- 2805 Cattail Ct Unit D
- 330 S Litchfield Dr
- 27419 W Molidor Rd
- 690 Harp Ave
- 692 Harp Ave
- 688 Harp Ave
- 694 Harp Ave
- 663 Timpani Place
- 686 Harp Ave
- 661 Timpani Place Unit 508
- 661 Timpani Place
- 696 Harp Ave
- 665 Timpani Place
- 684 Harp Ave
- 682 Harp Ave
- 667 Timpani Place
- 659 Timpani Place
- 685 Harp Ave
- 691 Harp Ave
- 689 Harp Ave Unit 2321
- 689 Harp Ave
- 693 Harp Ave Unit 2331
- 669 Timpani Place
Your Personal Tour Guide
Ask me questions while you tour the home.