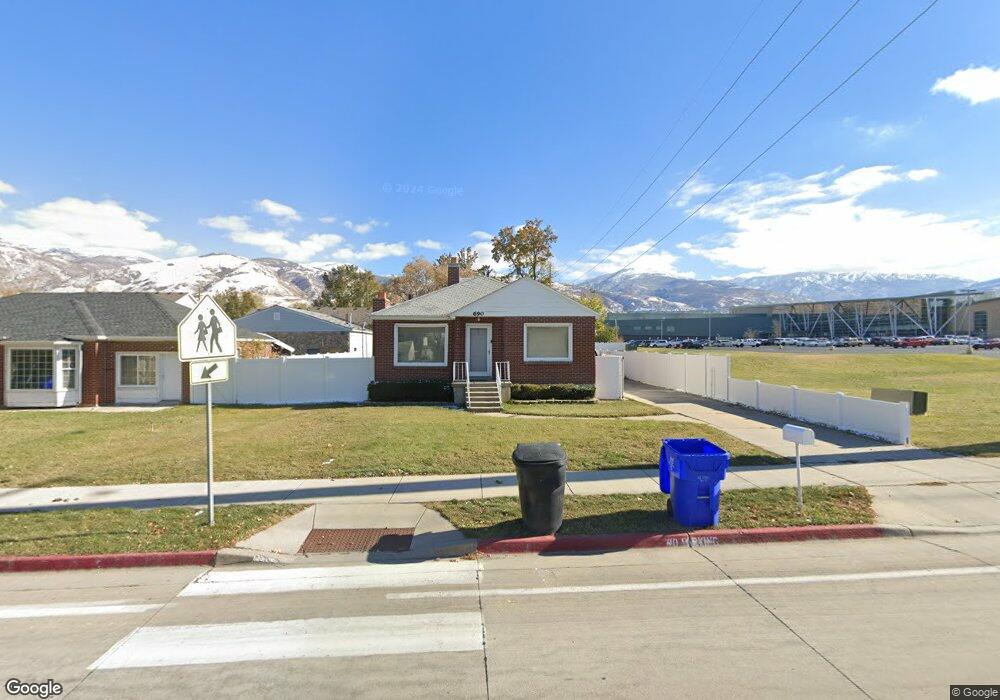
690 N 200 W Bountiful, UT 84010
Estimated Value: $428,000 - $529,000
5
Beds
2
Baths
1,918
Sq Ft
$251/Sq Ft
Est. Value
About This Home
This home is located at 690 N 200 W, Bountiful, UT 84010 and is currently estimated at $481,526, approximately $251 per square foot. 690 N 200 W is a home located in Davis County with nearby schools including Meadowbrook Elementary School, Bountiful Junior High School, and Viewmont High School.
Ownership History
Date
Name
Owned For
Owner Type
Purchase Details
Closed on
Jul 25, 2011
Sold by
Barlow Jeff
Bought by
Barlow Jeff
Current Estimated Value
Home Financials for this Owner
Home Financials are based on the most recent Mortgage that was taken out on this home.
Original Mortgage
$153,979
Outstanding Balance
$105,683
Interest Rate
4.46%
Mortgage Type
FHA
Estimated Equity
$375,843
Purchase Details
Closed on
Apr 26, 2005
Sold by
Bensan Glenn C and Bensan Millie J
Bought by
Barlew Jeff
Purchase Details
Closed on
Oct 15, 1998
Sold by
Benson Millie J and Benson Millie T
Bought by
Benson Glenn C and Benson Millie J
Home Financials for this Owner
Home Financials are based on the most recent Mortgage that was taken out on this home.
Original Mortgage
$128,700
Interest Rate
6.71%
Purchase Details
Closed on
May 9, 1997
Sold by
Smith Carole C
Bought by
Benson Glenn C and Benson Millie T
Home Financials for this Owner
Home Financials are based on the most recent Mortgage that was taken out on this home.
Original Mortgage
$125,139
Interest Rate
7.98%
Mortgage Type
FHA
Purchase Details
Closed on
Jan 30, 1996
Sold by
Smith Reid B
Bought by
Smith Carole C
Create a Home Valuation Report for This Property
The Home Valuation Report is an in-depth analysis detailing your home's value as well as a comparison with similar homes in the area
Purchase History
| Date | Buyer | Sale Price | Title Company |
|---|---|---|---|
| Barlow Jeff | -- | Lsi Title Agency Inc | |
| Barlew Jeff | -- | None Available | |
| Benson Glenn C | -- | Western States Title Company | |
| Benson Glenn C | -- | Western States Title Company | |
| Smith Carole C | -- | -- |
Source: Public Records
Mortgage History
| Date | Status | Borrower | Loan Amount |
|---|---|---|---|
| Open | Barlow Jeff | $153,979 | |
| Previous Owner | Benson Glenn C | $128,700 | |
| Previous Owner | Benson Glenn C | $125,139 |
Source: Public Records
Tax History
| Year | Tax Paid | Tax Assessment Tax Assessment Total Assessment is a certain percentage of the fair market value that is determined by local assessors to be the total taxable value of land and additions on the property. | Land | Improvement |
|---|---|---|---|---|
| 2025 | $3,086 | $243,100 | $133,804 | $109,296 |
| 2024 | $2,793 | $234,300 | $120,006 | $114,294 |
| 2023 | $2,563 | $410,000 | $220,402 | $189,598 |
| 2022 | $2,605 | $221,650 | $120,249 | $101,401 |
| 2021 | $2,293 | $313,000 | $157,390 | $155,610 |
| 2020 | $2,207 | $277,000 | $134,191 | $142,809 |
| 2019 | $2,126 | $271,000 | $139,998 | $131,002 |
| 2018 | $1,899 | $243,000 | $137,192 | $105,808 |
| 2016 | $1,511 | $102,025 | $48,810 | $53,215 |
| 2015 | $1,499 | $95,535 | $48,810 | $46,725 |
| 2014 | $1,707 | $114,935 | $48,810 | $66,125 |
| 2013 | -- | $102,838 | $37,353 | $65,485 |
Source: Public Records
Map
Nearby Homes
- 106 W 700 N
- 184 Park Shadows Cir
- 563 N 200 W
- 499 N 200 W Unit 30
- 1130 N 200 W
- 320 N 200 W Unit 4
- 332 N 300 W
- 17 E 400 N Unit 19B
- 366 W 1000 N
- 403 W 400 N Unit 1
- 1260 N 200 W
- 401 W 400 N Unit 49
- 399 W 400 N Unit 47
- 252 N Main St
- 256 N Main St
- 254 N Main St
- 235 W 1400 N
- 41 E 200 N Unit 6
- 49 E 200 N Unit 4
- 51 E 200 N Unit 3
- 700 N 200 W
- 710 N 200 W
- 701 Park Shadows Cir
- 701 Park Shadow Ln
- 707 Park Shadows Cir
- 707 Park Shadow Ln
- 693 Park Shadow Ln
- 693 Park Shadow Ln Unit 42
- 693 Park Shadows Cir
- 719 Park Shadows Cir
- 719 Park Shadow Ln
- 720 N 200 W
- 725 Park Shadows Cir
- 725 Park Shadow Ln
- 725 Park Shadow Ln Unit 38
- 696 Park Shadows Cir
- 711 N 200 W
- 647 N 200 W
- 737 Park Shadows Cir
- 737 Park Shadow Ln Unit 37
Your Personal Tour Guide
Ask me questions while you tour the home.