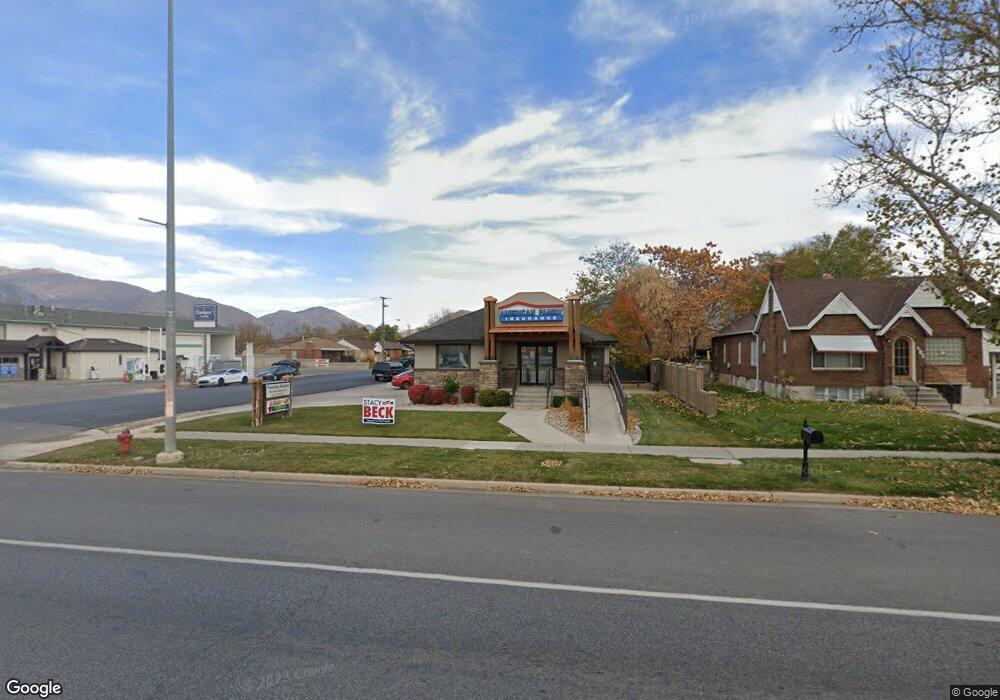
690 N Main St Spanish Fork, UT 84660
2
Beds
1
Bath
1,172
Sq Ft
6,534
Sq Ft Lot
About This Home
This home is located at 690 N Main St, Spanish Fork, UT 84660. 690 N Main St is a home located in Utah County with nearby schools including Park Elementary School, Diamond Fork Junior High School, and Spanish Fork Jr High School.
Ownership History
Date
Name
Owned For
Owner Type
Purchase Details
Closed on
Apr 30, 2013
Sold by
Zabriskie Dean R and Zabriskie Clancey E
Bought by
East Coast Holdings Llc
Home Financials for this Owner
Home Financials are based on the most recent Mortgage that was taken out on this home.
Original Mortgage
$222,675
Outstanding Balance
$158,214
Interest Rate
3.54%
Mortgage Type
Future Advance Clause Open End Mortgage
Purchase Details
Closed on
Oct 29, 1998
Sold by
Zabriskie Dean
Bought by
Zabriskie Dean R and Zabriskie Clancey E
Home Financials for this Owner
Home Financials are based on the most recent Mortgage that was taken out on this home.
Original Mortgage
$84,000
Interest Rate
6.61%
Mortgage Type
Commercial
Purchase Details
Closed on
Sep 22, 1997
Sold by
Zabriskie Thomas Mark and Zabriskie Paul Hales
Bought by
Zabriskie Dean
Home Financials for this Owner
Home Financials are based on the most recent Mortgage that was taken out on this home.
Original Mortgage
$62,800
Interest Rate
7.44%
Mortgage Type
Commercial
Create a Home Valuation Report for This Property
The Home Valuation Report is an in-depth analysis detailing your home's value as well as a comparison with similar homes in the area
Home Values in the Area
Average Home Value in this Area
Purchase History
| Date | Buyer | Sale Price | Title Company |
|---|---|---|---|
| East Coast Holdings Llc | -- | Absolute Title Agency | |
| Zabriskie Dean R | -- | Pro Title & Escrow Inc | |
| Zabriskie Dean | -- | -- |
Source: Public Records
Mortgage History
| Date | Status | Borrower | Loan Amount |
|---|---|---|---|
| Open | East Coast Holdings Llc | $222,675 | |
| Previous Owner | Zabriskie Dean R | $84,000 | |
| Previous Owner | Zabriskie Dean | $62,800 |
Source: Public Records
Tax History Compared to Growth
Tax History
| Year | Tax Paid | Tax Assessment Tax Assessment Total Assessment is a certain percentage of the fair market value that is determined by local assessors to be the total taxable value of land and additions on the property. | Land | Improvement |
|---|---|---|---|---|
| 2025 | $3,450 | $364,000 | $191,100 | $172,900 |
| 2024 | $3,450 | $355,600 | $0 | $0 |
| 2023 | $3,211 | $331,300 | $0 | $0 |
| 2022 | $3,113 | $315,000 | $161,000 | $154,000 |
| 2021 | $2,212 | $197,000 | $157,600 | $39,400 |
| 2020 | $2,346 | $203,100 | $57,400 | $145,700 |
| 2019 | $2,179 | $198,500 | $52,100 | $146,400 |
| 2018 | $2,102 | $185,100 | $49,700 | $135,400 |
| 2017 | $2,501 | $215,200 | $0 | $0 |
| 2016 | $2,390 | $202,900 | $0 | $0 |
| 2015 | $2,398 | $201,200 | $0 | $0 |
| 2014 | $2,371 | $199,600 | $0 | $0 |
Source: Public Records
Map
Nearby Homes