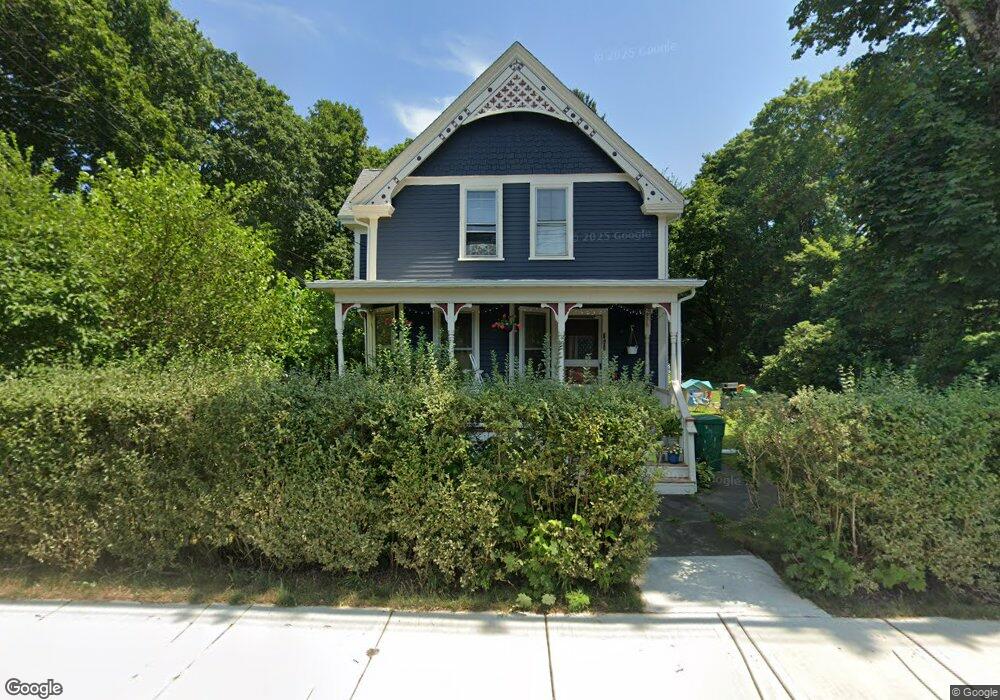
690 Park St Attleboro, MA 02703
Estimated Value: $444,357 - $485,000
3
Beds
2
Baths
1,445
Sq Ft
$322/Sq Ft
Est. Value
About This Home
This home is located at 690 Park St, Attleboro, MA 02703 and is currently estimated at $464,589, approximately $321 per square foot. 690 Park St is a home located in Bristol County with nearby schools including Hyman Fine Elementary School, Wamsutta Middle School, and Attleboro High School.
Ownership History
Date
Name
Owned For
Owner Type
Purchase Details
Closed on
Nov 30, 2006
Sold by
Walker Gordon R and Withers Jean D
Bought by
Mckay Paul D and Mckay Peta M
Current Estimated Value
Home Financials for this Owner
Home Financials are based on the most recent Mortgage that was taken out on this home.
Original Mortgage
$157,500
Outstanding Balance
$94,427
Interest Rate
6.36%
Mortgage Type
Purchase Money Mortgage
Estimated Equity
$370,162
Create a Home Valuation Report for This Property
The Home Valuation Report is an in-depth analysis detailing your home's value as well as a comparison with similar homes in the area
Home Values in the Area
Average Home Value in this Area
Purchase History
| Date | Buyer | Sale Price | Title Company |
|---|---|---|---|
| Mckay Paul D | $210,000 | -- |
Source: Public Records
Mortgage History
| Date | Status | Borrower | Loan Amount |
|---|---|---|---|
| Open | Mckay Paul D | $157,500 |
Source: Public Records
Tax History
| Year | Tax Paid | Tax Assessment Tax Assessment Total Assessment is a certain percentage of the fair market value that is determined by local assessors to be the total taxable value of land and additions on the property. | Land | Improvement |
|---|---|---|---|---|
| 2025 | $3,901 | $310,800 | $131,600 | $179,200 |
| 2024 | $3,916 | $307,600 | $131,600 | $176,000 |
| 2023 | $3,758 | $274,500 | $119,600 | $154,900 |
| 2022 | $3,643 | $252,100 | $113,900 | $138,200 |
| 2021 | $0 | $226,700 | $109,700 | $117,000 |
| 2020 | $0 | $225,800 | $106,500 | $119,300 |
| 2019 | $3,064 | $216,400 | $104,400 | $112,000 |
| 2018 | $2,906 | $196,100 | $101,400 | $94,700 |
| 2017 | $2,878 | $197,800 | $101,400 | $96,400 |
| 2016 | $2,725 | $183,900 | $94,800 | $89,100 |
| 2015 | $2,483 | $168,800 | $94,800 | $74,000 |
| 2014 | $2,401 | $161,700 | $89,900 | $71,800 |
Source: Public Records
Map
Nearby Homes
- 567 Park St
- 67 Steeple Chase Cir Unit 1
- 91 East St
- 36 Hazel St
- 0 Cherry Tree Ln
- 0 Paisley Way Unit 73482376
- 0 Paisley Way Unit 73482325
- 28 Pine St Unit C
- 11 Cherry Tree Ln
- 366 & 0 Pike Ave
- 5 Hope St
- 5 Foster St
- 0 Pike Ave
- 0 Rosedale Ln Unit 73469293
- 75 Benefit St
- 214 Steere St
- 70 Riverside Ave
- 3 Robert St
- 933 Pleasant St
- 64 Mechanic St Unit 3
Your Personal Tour Guide
Ask me questions while you tour the home.