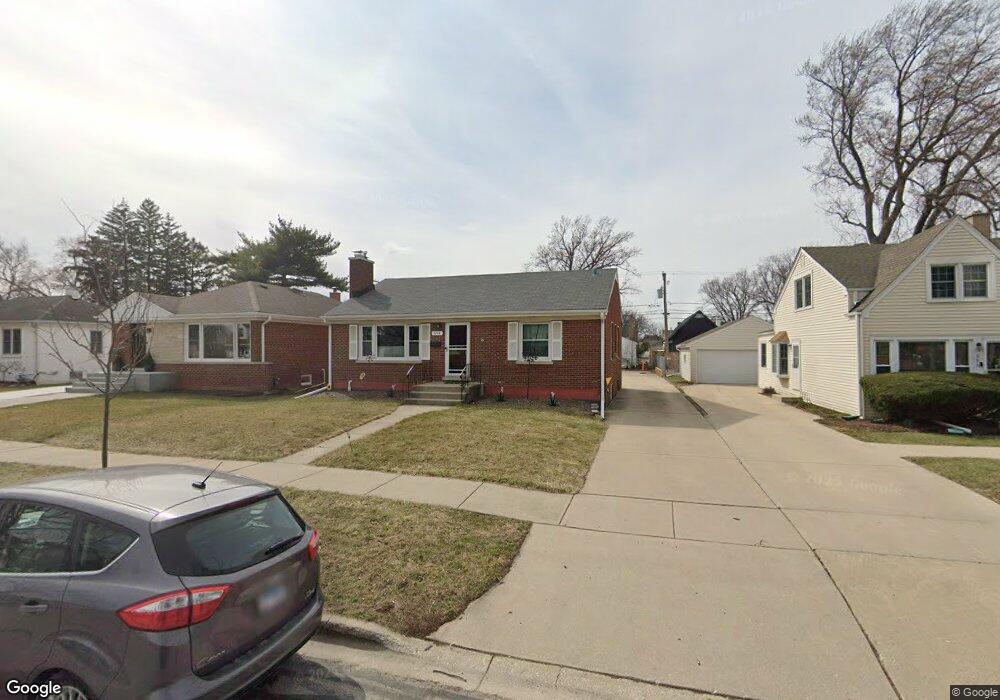
690 S Spring Rd Elmhurst, IL 60126
Estimated Value: $445,000 - $527,695
3
Beds
2
Baths
1,098
Sq Ft
$446/Sq Ft
Est. Value
About This Home
This home is located at 690 S Spring Rd, Elmhurst, IL 60126 and is currently estimated at $489,674, approximately $445 per square foot. 690 S Spring Rd is a home located in DuPage County with nearby schools including Lincoln Elementary School, Bryan Middle School, and York Community High School.
Ownership History
Date
Name
Owned For
Owner Type
Purchase Details
Closed on
Sep 9, 2011
Sold by
North Star Trust Company
Bought by
Moi Regina
Current Estimated Value
Home Financials for this Owner
Home Financials are based on the most recent Mortgage that was taken out on this home.
Original Mortgage
$168,000
Outstanding Balance
$115,812
Interest Rate
4.4%
Mortgage Type
New Conventional
Estimated Equity
$373,862
Purchase Details
Closed on
May 5, 2003
Sold by
North Star Trust Company
Bought by
Villa Park Bank Trust & Savings and Trust #2608
Create a Home Valuation Report for This Property
The Home Valuation Report is an in-depth analysis detailing your home's value as well as a comparison with similar homes in the area
Home Values in the Area
Average Home Value in this Area
Purchase History
| Date | Buyer | Sale Price | Title Company |
|---|---|---|---|
| Moi Regina | $212,000 | Ctic | |
| Villa Park Bank Trust & Savings | -- | -- |
Source: Public Records
Mortgage History
| Date | Status | Borrower | Loan Amount |
|---|---|---|---|
| Open | Moi Regina | $168,000 |
Source: Public Records
Tax History
| Year | Tax Paid | Tax Assessment Tax Assessment Total Assessment is a certain percentage of the fair market value that is determined by local assessors to be the total taxable value of land and additions on the property. | Land | Improvement |
|---|---|---|---|---|
| 2024 | $6,844 | $121,560 | $57,433 | $64,127 |
| 2023 | $6,339 | $112,410 | $53,110 | $59,300 |
| 2022 | $6,189 | $108,070 | $51,060 | $57,010 |
| 2021 | $6,032 | $105,380 | $49,790 | $55,590 |
| 2020 | $5,796 | $103,070 | $48,700 | $54,370 |
| 2019 | $5,666 | $97,990 | $46,300 | $51,690 |
| 2018 | $5,092 | $88,190 | $43,830 | $44,360 |
| 2017 | $4,972 | $84,040 | $41,770 | $42,270 |
| 2016 | $4,857 | $79,170 | $39,350 | $39,820 |
| 2015 | $4,796 | $73,760 | $36,660 | $37,100 |
| 2014 | $5,906 | $82,640 | $33,470 | $49,170 |
| 2013 | $5,844 | $83,800 | $33,940 | $49,860 |
Source: Public Records
Map
Nearby Homes
- 745 S Hillside Ave
- 742 S Saylor Ave
- 634 S Spring Rd
- 663 S Hawthorne Ave
- 688 S Mitchell Ave
- 696 S Prospect Ave
- 722 S Berkley Ave
- 594 S Fairfield Ave
- 611 S Prospect Ave
- 769 S Fairview Ave
- 680 S Bryan St
- 570 S Parkside Ave
- 849 S Swain Ave
- 868 S Spring Rd
- 366 W Eggleston Ave
- 15 Manchester Ln
- 878 S Parkside Ave
- 694 S York St
- 469 S Sunnyside Ave
- 881 S Bryan St
- 694 S Spring Rd
- 686 S Spring Rd
- 700 S Spring Rd
- 682 S Spring Rd
- 702 S Spring Rd
- 678 S Spring Rd
- 689 S Hillside Ave
- 687 S Spring Rd
- 695 S Hillside Ave
- 693 S Spring Rd
- 685 S Spring Rd
- 691 S Hillside Ave
- 683 S Hillside Ave
- 699 S Hillside Ave
- 701 S Spring Rd
- 706 S Spring Rd
- 697 S Spring Rd
- 679 S Spring Rd
- 674 S Spring Rd
- 675 S Spring Rd
Your Personal Tour Guide
Ask me questions while you tour the home.