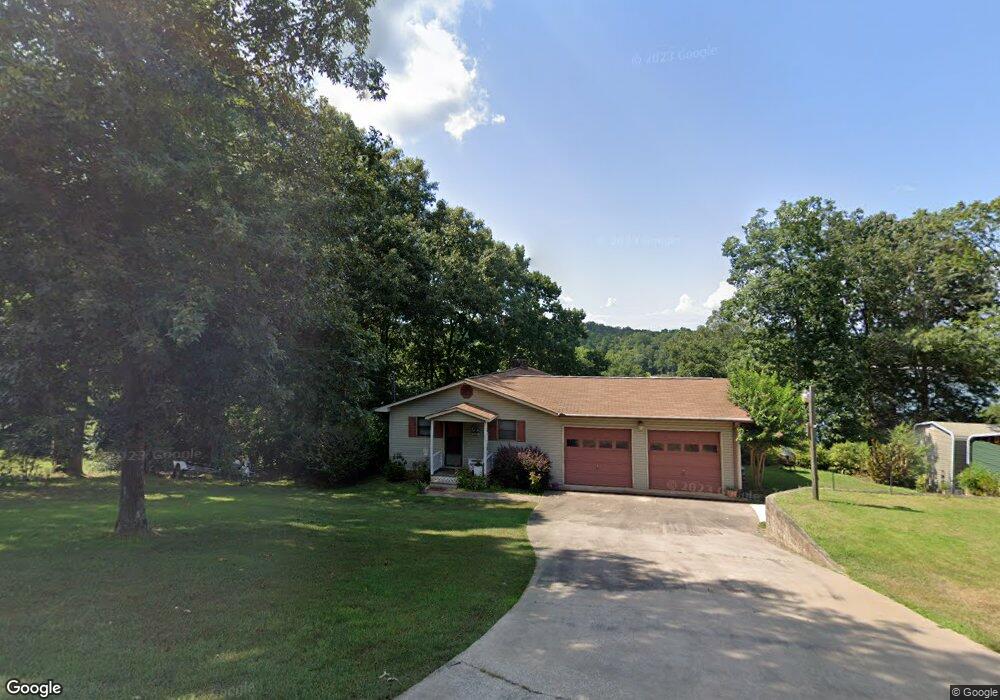
690 Whippoorwill Cir Lavonia, GA 30553
Estimated Value: $458,000 - $757,000
3
Beds
2
Baths
2,000
Sq Ft
$309/Sq Ft
Est. Value
About This Home
This home is located at 690 Whippoorwill Cir, Lavonia, GA 30553 and is currently estimated at $617,878, approximately $308 per square foot. 690 Whippoorwill Cir is a home located in Hart County with nearby schools including Hart County High School.
Ownership History
Date
Name
Owned For
Owner Type
Purchase Details
Closed on
Oct 29, 2018
Sold by
Barta John
Bought by
Barta John and Barta Susan R
Current Estimated Value
Home Financials for this Owner
Home Financials are based on the most recent Mortgage that was taken out on this home.
Original Mortgage
$158,998
Outstanding Balance
$94,809
Interest Rate
4.7%
Mortgage Type
New Conventional
Estimated Equity
$523,069
Purchase Details
Closed on
Jul 22, 2005
Sold by
Dove Fletcher A
Bought by
Barta John
Home Financials for this Owner
Home Financials are based on the most recent Mortgage that was taken out on this home.
Original Mortgage
$208,000
Interest Rate
5.51%
Mortgage Type
New Conventional
Purchase Details
Closed on
May 1, 2004
Purchase Details
Closed on
Apr 1, 1996
Purchase Details
Closed on
Feb 1, 1986
Purchase Details
Closed on
Jun 1, 1976
Purchase Details
Closed on
May 1, 1961
Create a Home Valuation Report for This Property
The Home Valuation Report is an in-depth analysis detailing your home's value as well as a comparison with similar homes in the area
Home Values in the Area
Average Home Value in this Area
Purchase History
| Date | Buyer | Sale Price | Title Company |
|---|---|---|---|
| Barta John | -- | -- | |
| Barta John | $260,000 | -- | |
| -- | $260,000 | -- | |
| -- | -- | -- | |
| -- | $9,000 | -- | |
| -- | -- | -- | |
| -- | -- | -- |
Source: Public Records
Mortgage History
| Date | Status | Borrower | Loan Amount |
|---|---|---|---|
| Open | Barta John | $158,998 | |
| Previous Owner | Barta John | $208,000 |
Source: Public Records
Tax History Compared to Growth
Tax History
| Year | Tax Paid | Tax Assessment Tax Assessment Total Assessment is a certain percentage of the fair market value that is determined by local assessors to be the total taxable value of land and additions on the property. | Land | Improvement |
|---|---|---|---|---|
| 2024 | $2,238 | $144,915 | $80,000 | $64,915 |
| 2023 | $2,260 | $135,719 | $80,000 | $55,719 |
| 2022 | $2,177 | $130,744 | $80,000 | $50,744 |
| 2021 | $1,910 | $102,981 | $56,000 | $46,981 |
| 2020 | $1,799 | $92,913 | $48,000 | $44,913 |
| 2019 | $1,701 | $87,027 | $44,000 | $43,027 |
| 2018 | $1,726 | $87,316 | $44,000 | $43,316 |
| 2017 | $1,728 | $86,915 | $44,000 | $42,915 |
| 2016 | $1,736 | $84,650 | $42,000 | $42,650 |
| 2015 | $1,655 | $84,997 | $43,200 | $41,797 |
| 2014 | $1,840 | $92,621 | $48,000 | $44,621 |
| 2013 | -- | $93,138 | $48,000 | $45,138 |
Source: Public Records
Map
Nearby Homes
- 142 Water Oak Dell Dr
- 679 Parkertown Heights Rd
- 714 Rocky Ford Rd
- 0 Walters Rd Unit 10589594
- 0 Cherokee Cir Unit 10494817
- 155 Collins Rd
- 170 Collins Rd
- 310 Park Place Dr Unit LOT 3
- 346 Park Place Dr Unit LOT 5
- 132 Cherokee Ln
- 0 Harbor Light Marina Rd Unit 20280801
- 0 Harbor Light Marina Rd Unit 10406821
- 44 Cherokee Plaza
- 3119 Rock Springs Rd
- 672 Tugaloo Heights Cir
- 346 Lake Club Cir
- 672 Tugaloo Heights Cir Cir
- 0 Bow Dr Unit 10349224
- 0 Bow Dr Unit 20241348
- 0 Arrow Ln Unit 260 10576662
- 664 Whippoorwill Cir
- 673 Whippoorwill Cir
- 71 Brookdale Dr
- 810 Whippoorwill Cir
- Lot 1 Brookdale Point
- 470 Brookdale Dr
- 763 Whippoorwill Cir
- 602 Whippoorwill Cir
- 582 Whippoorwill Cir
- 45 Brookdale Dr
- 532 Brookdale Dr
- 568 Whippoorwill Cir
- 33 Jollins Rd
- 410 Brookdale Dr
- 488 Brookdale Dr
- 0 Brookdale Dr
- 0 Brookdale Dr Unit 20160479
- 0 Brookdale Dr Unit 7378316
- 0 Brookdale Dr Unit 7070985
- 0 Brookdale Dr Unit 7376332