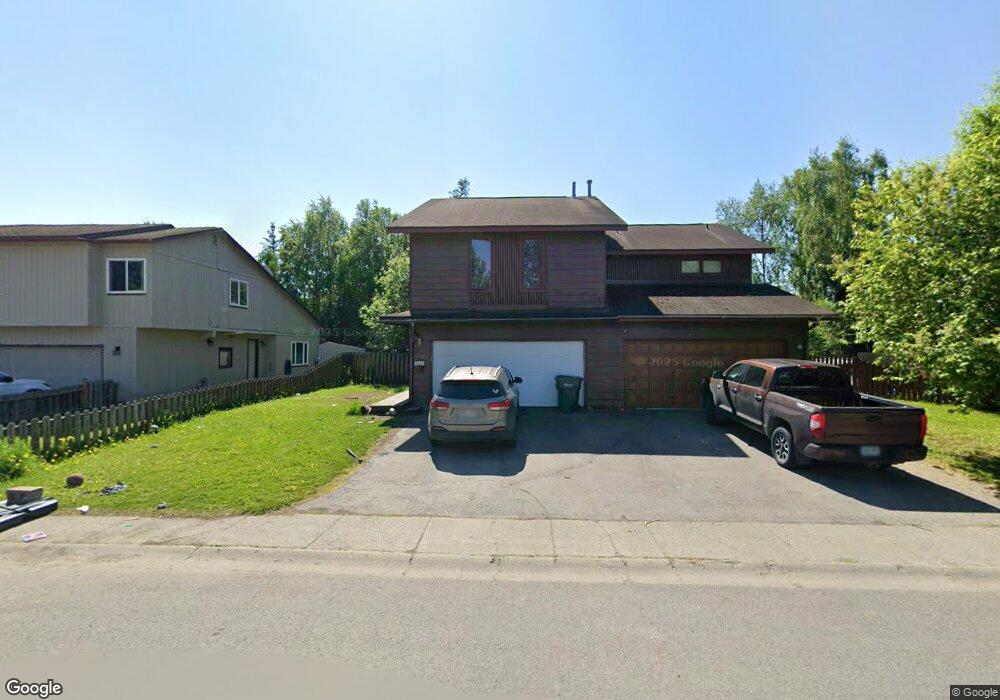
6900 Cape Lisburne Loop Anchorage, AK 99504
Scenic Foothills NeighborhoodEstimated Value: $283,000 - $369,709
3
Beds
3
Baths
1,620
Sq Ft
$203/Sq Ft
Est. Value
About This Home
This home is located at 6900 Cape Lisburne Loop, Anchorage, AK 99504 and is currently estimated at $328,427, approximately $202 per square foot. 6900 Cape Lisburne Loop is a home located in Anchorage Municipality with nearby schools including Baxter Elementary School, Wendler Middle School, and Bartlett High School.
Ownership History
Date
Name
Owned For
Owner Type
Purchase Details
Closed on
Nov 4, 2010
Sold by
Degregorio Steven M
Bought by
Degregorio Steven M
Current Estimated Value
Home Financials for this Owner
Home Financials are based on the most recent Mortgage that was taken out on this home.
Original Mortgage
$140,500
Outstanding Balance
$91,892
Interest Rate
4.33%
Mortgage Type
VA
Estimated Equity
$236,535
Purchase Details
Closed on
Aug 24, 2000
Sold by
Rivera Enoirda
Bought by
Degregorio Steven M
Home Financials for this Owner
Home Financials are based on the most recent Mortgage that was taken out on this home.
Original Mortgage
$156,050
Interest Rate
8.15%
Mortgage Type
New Conventional
Purchase Details
Closed on
Mar 9, 1992
Sold by
Svoboda Loretta M
Bought by
Rivera Ruben and Rivera Enoirda
Home Financials for this Owner
Home Financials are based on the most recent Mortgage that was taken out on this home.
Original Mortgage
$108,000
Interest Rate
8.58%
Mortgage Type
VA
Purchase Details
Closed on
Jul 13, 1987
Sold by
Federal National Mortgage Assn
Bought by
Svoboda Loretta M
Home Financials for this Owner
Home Financials are based on the most recent Mortgage that was taken out on this home.
Original Mortgage
$102,500
Interest Rate
10.76%
Mortgage Type
Seller Take Back
Create a Home Valuation Report for This Property
The Home Valuation Report is an in-depth analysis detailing your home's value as well as a comparison with similar homes in the area
Home Values in the Area
Average Home Value in this Area
Purchase History
| Date | Buyer | Sale Price | Title Company |
|---|---|---|---|
| Degregorio Steven M | -- | Pnt | |
| Degregorio Steven M | -- | -- | |
| Rivera Ruben | -- | -- | |
| Rivera Ruben | -- | -- | |
| Svoboda Loretta M | -- | -- | |
| Svoboda Loretta M | -- | -- | |
| Svoboda Loretta M | -- | -- |
Source: Public Records
Mortgage History
| Date | Status | Borrower | Loan Amount |
|---|---|---|---|
| Open | Degregorio Steven M | $140,500 | |
| Closed | Degregorio Steven M | $156,050 | |
| Previous Owner | Rivera Ruben | $108,000 | |
| Previous Owner | Svoboda Loretta M | $102,500 |
Source: Public Records
Tax History
| Year | Tax Paid | Tax Assessment Tax Assessment Total Assessment is a certain percentage of the fair market value that is determined by local assessors to be the total taxable value of land and additions on the property. | Land | Improvement |
|---|---|---|---|---|
| 2025 | $5,131 | $323,100 | $84,200 | $238,900 |
| 2024 | $5,131 | $317,800 | $84,200 | $233,600 |
| 2023 | $4,957 | $291,100 | $84,200 | $206,900 |
| 2022 | $4,609 | $273,700 | $84,200 | $189,500 |
| 2021 | $4,422 | $245,400 | $84,200 | $161,200 |
| 2020 | $4,281 | $251,800 | $84,200 | $167,600 |
| 2019 | $4,083 | $249,600 | $84,200 | $165,400 |
| 2018 | $4,021 | $245,200 | $87,800 | $157,400 |
| 2017 | $3,928 | $250,800 | $83,400 | $167,400 |
| 2016 | $3,495 | $252,900 | $83,400 | $169,500 |
| 2015 | $3,495 | $243,800 | $76,200 | $167,600 |
| 2014 | $3,495 | $234,100 | $76,200 | $157,900 |
Source: Public Records
Map
Nearby Homes
- 3213 Tayshee Cir
- 7017 Cape Lisburne Loop
- 3121 Rosella St Unit D
- 6541 Cimarron Cir
- Slm L1 B1
- L1 Whisper Hill Cir
- 2550 Chandalar Dr
- 6911 Gemini Dr Unit A-4
- 6758 Lunar Dr Unit B2
- 6918 Gemini Dr Unit B2
- 6712 Lunar Dr Unit K2
- 6251 E 41st Ct Unit 6251
- 4154 Hampton Dr
- 6307 Regent Dr
- 3973 Defiance St
- 4407 Irene Dr
- 5708 Kennyhill Dr
- 3209 Eastgate Place Unit 104
- 7524 Eastbrook Cir
- 3500 Skipper St
- 6904 Cape Lisburne Loop
- 6904 Cape Lisburne Loop Unit B
- 6852 Cape Lisburne Loop
- 6848 Cape Lisburne Loop
- 6908 Cape Lisburne Loop
- 6851 Baxter Terrace Cir
- 6912 Cape Lisburne Loop
- 6841 Baxter Terrace Cir
- 6861 Baxter Terrace Cir
- 6844 Cape Lisburne Loop
- 6831 Baxter Terrace Cir
- 6901 Cape Lisburne Loop
- 6871 Baxter Terrace Cir
- 6825 Cape Lisburne Loop
- 6916 Cape Lisburne Loop
- 6821 Baxter Terrace Cir
- 6881 Baxter Terrace Cir
- 6840 Cape Lisburne Loop
- 6811 Baxter Terrace Cir
- 6920 Cape Lisburne Loop
Your Personal Tour Guide
Ask me questions while you tour the home.