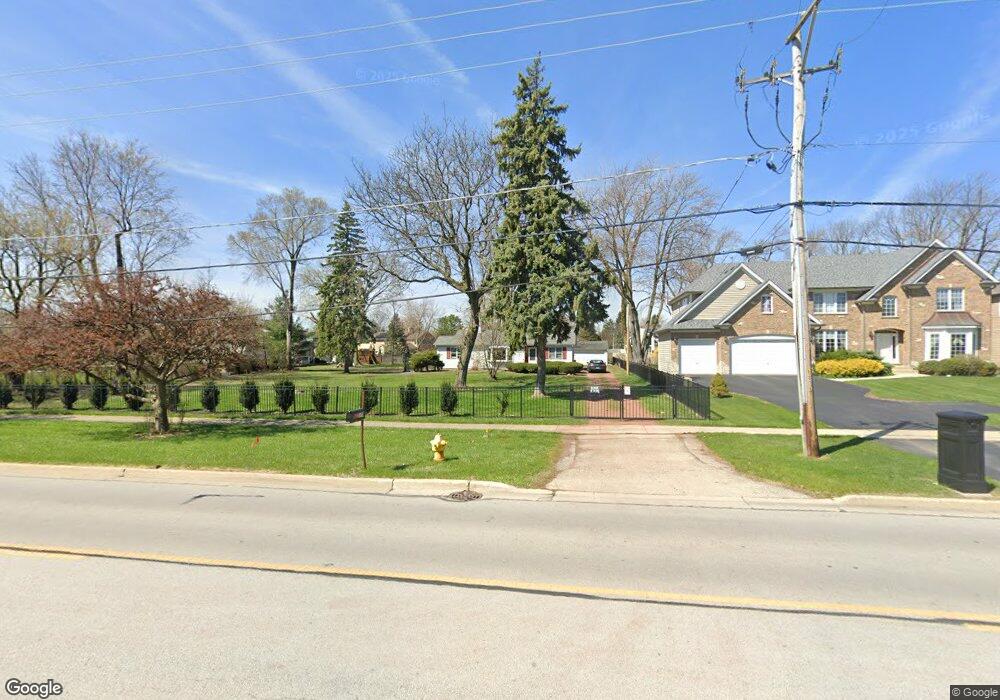
6900 Fairview Ave Downers Grove, IL 60516
South Downers Grove NeighborhoodEstimated Value: $432,815 - $519,000
--
Bed
--
Bath
1,254
Sq Ft
$383/Sq Ft
Est. Value
About This Home
This home is located at 6900 Fairview Ave, Downers Grove, IL 60516 and is currently estimated at $480,204, approximately $382 per square foot. 6900 Fairview Ave is a home located in DuPage County with nearby schools including El Sierra Elementary School, O'Neill Middle School, and Downers Grove South High School.
Ownership History
Date
Name
Owned For
Owner Type
Purchase Details
Closed on
Apr 10, 2021
Sold by
Canino Louis and Canino Laura
Bought by
Canino Laura
Current Estimated Value
Home Financials for this Owner
Home Financials are based on the most recent Mortgage that was taken out on this home.
Original Mortgage
$247,000
Outstanding Balance
$228,329
Interest Rate
4.62%
Mortgage Type
New Conventional
Estimated Equity
$251,875
Purchase Details
Closed on
Jun 19, 2017
Sold by
Swan Virginia and Swan William
Bought by
Canino Louis S and Canino Laura M
Home Financials for this Owner
Home Financials are based on the most recent Mortgage that was taken out on this home.
Original Mortgage
$260,000
Interest Rate
4.87%
Mortgage Type
New Conventional
Purchase Details
Closed on
Nov 5, 2014
Sold by
Kratochvil Craig
Bought by
Swan William and Swan Victoria
Purchase Details
Closed on
Jul 15, 2009
Sold by
Kratochvil Georgina
Bought by
Kratochvil Craig and 6900 Fairview Trust
Create a Home Valuation Report for This Property
The Home Valuation Report is an in-depth analysis detailing your home's value as well as a comparison with similar homes in the area
Home Values in the Area
Average Home Value in this Area
Purchase History
| Date | Buyer | Sale Price | Title Company |
|---|---|---|---|
| Canino Laura | -- | Attorney | |
| Canino Louis S | $325,000 | North American Title Company | |
| Swan William | $200,000 | Fidelity National Title | |
| Kratochvil Craig | -- | None Available |
Source: Public Records
Mortgage History
| Date | Status | Borrower | Loan Amount |
|---|---|---|---|
| Open | Canino Laura | $247,000 | |
| Closed | Canino Louis S | $260,000 |
Source: Public Records
Tax History Compared to Growth
Tax History
| Year | Tax Paid | Tax Assessment Tax Assessment Total Assessment is a certain percentage of the fair market value that is determined by local assessors to be the total taxable value of land and additions on the property. | Land | Improvement |
|---|---|---|---|---|
| 2024 | $6,851 | $120,496 | $66,704 | $53,792 |
| 2023 | $6,539 | $110,770 | $61,320 | $49,450 |
| 2022 | $6,191 | $105,910 | $58,630 | $47,280 |
| 2021 | $5,796 | $104,700 | $57,960 | $46,740 |
| 2020 | $5,693 | $102,620 | $56,810 | $45,810 |
| 2019 | $5,522 | $98,460 | $54,510 | $43,950 |
| 2018 | $5,600 | $98,670 | $54,250 | $44,420 |
| 2017 | $4,943 | $92,410 | $52,250 | $40,160 |
| 2016 | $4,841 | $88,200 | $49,870 | $38,330 |
| 2015 | $4,781 | $82,980 | $46,920 | $36,060 |
| 2014 | $4,781 | $80,680 | $45,620 | $35,060 |
| 2013 | $4,683 | $80,310 | $45,410 | $34,900 |
Source: Public Records
Map
Nearby Homes
- 6722 Sweetbriar Ln
- 1813 Kelly Ct
- 6901 Meadowcrest Dr
- 400 74th St Unit 106
- 7303 Grand Ave Unit 102
- 1408 Spruce Ln
- 521 73rd St Unit 105
- 7318 Winthrop Way Unit 4
- 7315 Winthrop Way Unit 6
- 7333 Winthrop Way Unit 10
- 824 Oxford St
- 1409 S Williams St
- 1208 Connamara Ct
- 1209 W Charles Ln
- 6565 Main St Unit 204
- 6545 Main St Unit 408
- 419 63rd St
- 1526 Shelley Ct
- 2505 75th St
- 1003 Oxford St
- 6822 Fairview Ave
- 6900 Churchill Ct
- 6907 Churchill Ct
- 6818 Fairview Ave
- 6906 Churchill Ct
- 6831 Osage Ave
- 6813 Wolf Place
- 6913 Churchill Ct
- 6812 Wolf Place
- 6904 Irish Ct
- 6901 Fairview Ave
- 6837 Osage Ave
- 6843 Osage Ave
- 6825 Osage Ave
- 6912 Churchill Ct
- 6908 Irish Ct Unit 2
- 6851 Fairview Ave
- 6919 Churchill Ct
- 6807 Wolf Place
- 6819 Osage Ave