6900 Roswell Rd Unit Q9 Atlanta, GA 30328
Estimated Value: $212,000 - $235,000
2
Beds
2
Baths
1,040
Sq Ft
$220/Sq Ft
Est. Value
About This Home
This home is located at 6900 Roswell Rd Unit Q9, Atlanta, GA 30328 and is currently estimated at $228,416, approximately $219 per square foot. 6900 Roswell Rd Unit Q9 is a home located in Fulton County with nearby schools including Spalding Drive Elementary School, Ridgeview Charter School, and Riverwood International Charter School.
Ownership History
Date
Name
Owned For
Owner Type
Purchase Details
Closed on
Oct 25, 2024
Sold by
Bridges Allison
Bought by
Atli Onder
Current Estimated Value
Purchase Details
Closed on
Jan 29, 2018
Sold by
Ozelci Al
Bought by
Bridges Allison and Onder Atli
Home Financials for this Owner
Home Financials are based on the most recent Mortgage that was taken out on this home.
Original Mortgage
$84,100
Interest Rate
3.99%
Mortgage Type
New Conventional
Purchase Details
Closed on
Sep 5, 2017
Sold by
Nathan Benge
Bought by
Ozelci Al
Purchase Details
Closed on
Feb 10, 2017
Sold by
Benge Heather B
Bought by
Nathan Benge
Purchase Details
Closed on
Jun 17, 2009
Sold by
6900 Roswell Associates Llc
Bought by
Benge Nathan and Benge Heather B
Home Financials for this Owner
Home Financials are based on the most recent Mortgage that was taken out on this home.
Original Mortgage
$117,727
Interest Rate
5.53%
Mortgage Type
FHA
Create a Home Valuation Report for This Property
The Home Valuation Report is an in-depth analysis detailing your home's value as well as a comparison with similar homes in the area
Home Values in the Area
Average Home Value in this Area
Purchase History
| Date | Buyer | Sale Price | Title Company |
|---|---|---|---|
| Atli Onder | -- | -- | |
| Bridges Allison | $105,000 | -- | |
| Ozelci Al | $105,000 | -- | |
| Nathan Benge | -- | -- | |
| Benge Nathan | $119,900 | -- |
Source: Public Records
Mortgage History
| Date | Status | Borrower | Loan Amount |
|---|---|---|---|
| Previous Owner | Bridges Allison | $84,100 | |
| Previous Owner | Benge Nathan | $117,727 |
Source: Public Records
Tax History Compared to Growth
Tax History
| Year | Tax Paid | Tax Assessment Tax Assessment Total Assessment is a certain percentage of the fair market value that is determined by local assessors to be the total taxable value of land and additions on the property. | Land | Improvement |
|---|---|---|---|---|
| 2025 | $2,505 | $81,200 | $11,360 | $69,840 |
| 2023 | $2,293 | $81,240 | $11,360 | $69,880 |
| 2022 | $2,328 | $75,000 | $7,800 | $67,200 |
| 2021 | $2,319 | $72,800 | $7,560 | $65,240 |
| 2020 | $1,366 | $64,000 | $7,480 | $56,520 |
| 2019 | $1,371 | $42,000 | $5,040 | $36,960 |
| 2018 | $1,996 | $60,560 | $6,400 | $54,160 |
| 2017 | $1,373 | $40,480 | $3,800 | $36,680 |
| 2016 | $1,373 | $40,480 | $3,800 | $36,680 |
| 2015 | $1,378 | $40,480 | $3,800 | $36,680 |
| 2014 | $919 | $25,960 | $2,600 | $23,360 |
Source: Public Records
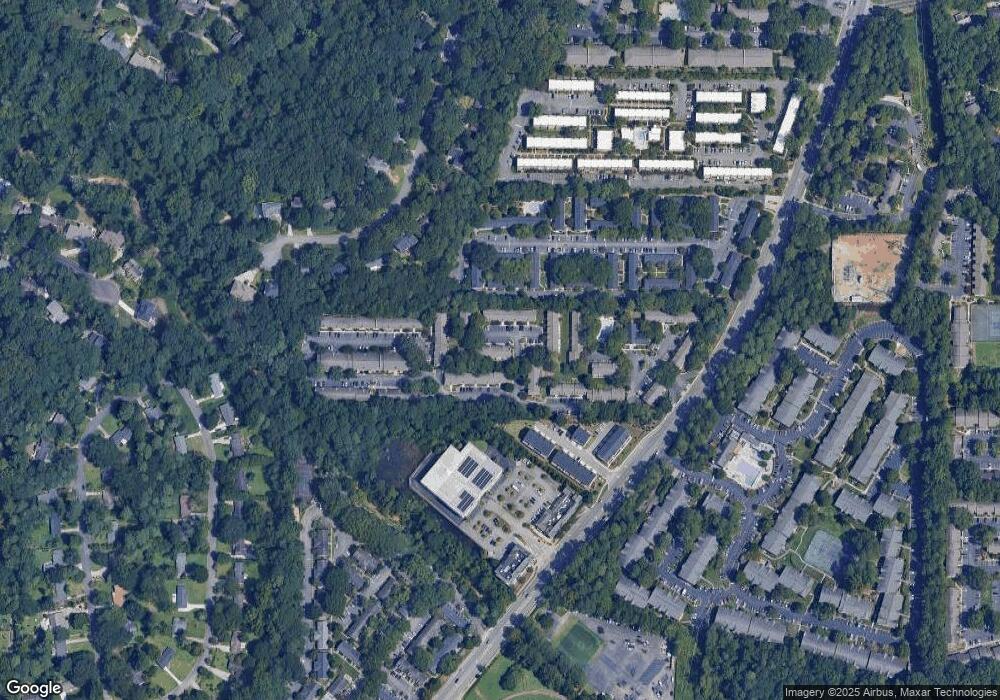
Map
Nearby Homes
- 6900 Roswell Rd Unit F6
- 6900 Roswell Rd Unit Q26
- 6900 Roswell Rd Unit G5
- 6900 Roswell Rd Unit 7N
- 6900 Roswell Rd Unit G1
- 6900 Roswell Rd Unit F8
- 6900 Roswell Rd Unit 10Q
- 6900 Roswell Rd Unit 5G
- 6900 Roswell Rd Unit K8
- 6892 Roswell Rd
- 6940 Roswell Rd Unit 15C
- 6940 Roswell Rd Unit 21A
- 6940 Roswell Rd Unit 16B
- 6940 Roswell Rd Unit B4
- 6940 Roswell Rd Unit 19C
- 6825 Sunny Brook Ln NE
- 6851 Roswell Rd NE Unit E1
- 6851 Roswell Rd NE Unit O28
- 6851 Roswell Rd NE Unit D14
- 6851 Roswell Rd NE Unit B13
- 6900 Roswell Rd Unit 8F
- 6900 Roswell Rd Unit 6F
- 6900 Roswell Rd Unit 3E
- 6900 Roswell Rd Unit Q10
- 6900 Roswell Rd Unit C1
- 6900 Roswell Rd Unit 8
- 6900 Roswell Rd Unit H-6
- 6900 Roswell Rd Unit I4
- 6900 Roswell Rd Unit M5
- 6900 Roswell Rd Unit L10
- 6900 Roswell Rd Unit F2
- 6900 Roswell Rd Unit N4
- 6900 Roswell Rd Unit M4
- 6900 Roswell Rd Unit G3
- 6900 Roswell Rd Unit N9
- 6900 Roswell Rd Unit M1
- 6900 Roswell Rd Unit J4
- 6900 Roswell Rd Unit N-15
- 6900 Roswell Rd Unit L6
- 6900 Roswell Rd Unit I1