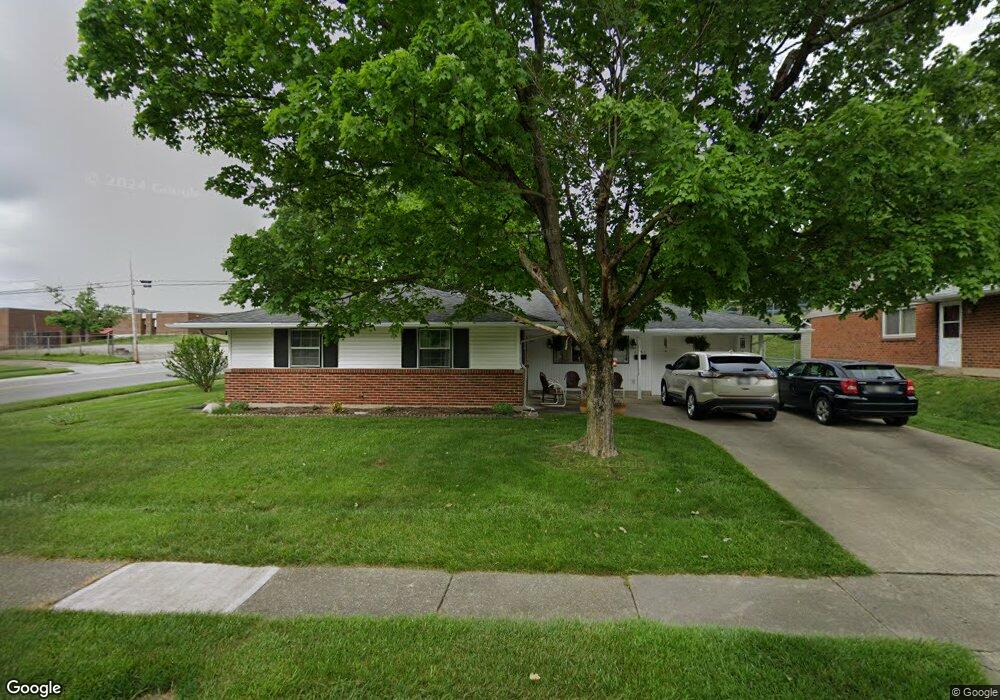
6901 Bascombe Dr Dayton, OH 45424
Estimated Value: $200,000 - $221,000
4
Beds
2
Baths
1,579
Sq Ft
$133/Sq Ft
Est. Value
About This Home
This home is located at 6901 Bascombe Dr, Dayton, OH 45424 and is currently estimated at $209,780, approximately $132 per square foot. 6901 Bascombe Dr is a home located in Montgomery County with nearby schools including Wayne High School and Huber Heights Christian Academy.
Ownership History
Date
Name
Owned For
Owner Type
Purchase Details
Closed on
Sep 7, 2016
Sold by
Sweeney Robert J and Edwards Michael R
Bought by
Clark Roger D and Clark Antoinette M
Current Estimated Value
Home Financials for this Owner
Home Financials are based on the most recent Mortgage that was taken out on this home.
Original Mortgage
$49,500
Outstanding Balance
$39,281
Interest Rate
3.48%
Mortgage Type
Purchase Money Mortgage
Estimated Equity
$170,499
Purchase Details
Closed on
Jun 25, 2010
Sold by
Domzella Sandra S and Schutte Sally A
Bought by
Sweeney Robert J and Sweeney Veronica B
Home Financials for this Owner
Home Financials are based on the most recent Mortgage that was taken out on this home.
Original Mortgage
$60,000
Interest Rate
4.86%
Mortgage Type
New Conventional
Purchase Details
Closed on
Dec 28, 2009
Sold by
Estate Of Walter C Schutte
Bought by
Domzella Sandra S and Schutte Sally A
Purchase Details
Closed on
Apr 25, 2006
Sold by
Estate Of Naomi D Schutte
Bought by
Schutte Walter C
Create a Home Valuation Report for This Property
The Home Valuation Report is an in-depth analysis detailing your home's value as well as a comparison with similar homes in the area
Home Values in the Area
Average Home Value in this Area
Purchase History
| Date | Buyer | Sale Price | Title Company |
|---|---|---|---|
| Clark Roger D | $55,000 | Hallmark Title | |
| Sweeney Robert J | $80,000 | Attorney | |
| Domzella Sandra S | -- | None Available | |
| Schutte Walter C | -- | None Available |
Source: Public Records
Mortgage History
| Date | Status | Borrower | Loan Amount |
|---|---|---|---|
| Open | Clark Roger D | $49,500 | |
| Previous Owner | Sweeney Robert J | $60,000 |
Source: Public Records
Tax History
| Year | Tax Paid | Tax Assessment Tax Assessment Total Assessment is a certain percentage of the fair market value that is determined by local assessors to be the total taxable value of land and additions on the property. | Land | Improvement |
|---|---|---|---|---|
| 2025 | $2,885 | $54,080 | $10,150 | $43,930 |
| 2024 | $2,786 | $54,080 | $10,150 | $43,930 |
| 2023 | $2,786 | $54,080 | $10,150 | $43,930 |
| 2022 | $2,436 | $37,250 | $7,000 | $30,250 |
| 2021 | $2,471 | $37,250 | $7,000 | $30,250 |
| 2020 | $2,473 | $37,250 | $7,000 | $30,250 |
| 2019 | $2,405 | $32,030 | $7,000 | $25,030 |
| 2018 | $2,413 | $32,030 | $7,000 | $25,030 |
| 2017 | $2,397 | $32,030 | $7,000 | $25,030 |
| 2016 | $2,279 | $29,670 | $7,000 | $22,670 |
| 2015 | $2,250 | $29,670 | $7,000 | $22,670 |
| 2014 | $2,250 | $29,670 | $7,000 | $22,670 |
| 2012 | -- | $31,970 | $8,750 | $23,220 |
Source: Public Records
Map
Nearby Homes
- 5957 Longford Rd
- 5917 Longford Rd
- 7069 Harshmanville Rd
- 7287 Claircrest Dr
- 5934 Troy Villa Blvd Unit 20066
- 5906 Troy Villa Blvd Unit 20052
- 6654 Harshmanville Rd
- 5812 Troy Villa Blvd Unit 20005
- 5667 Troy Villa Blvd Unit 20081
- 6324 Larcomb Dr
- 5871 Troy Villa Blvd Unit 20171
- 7356 Natoma Place
- 7431 Troy Manor Rd
- 7371 Damascus Dr
- 6533 Millhoff Dr
- 6226 Hemingway Rd
- 6483 Highbury Rd
- 6601 Grovehill Dr
- 7505 Mount Ranier Unit 12117
- 6308 Hemingway Rd
- 6911 Bascombe Dr
- 5973 Longford Rd
- 6027 Longford Rd
- 6921 Bascombe Dr
- 5980 Longford Rd
- 5988 Longford Rd
- 5965 Longford Rd
- 7000 Claybeck Dr
- 6035 Longford Rd
- 6931 Bascombe Dr
- 6026 Longford Rd
- 7006 Claybeck Dr
- 6034 Longford Rd
- 7030 Cliffstone Dr
- 7005 Claybeck Dr
- 6042 Longford Rd
- 5949 Longford Rd
- 6043 Longford Rd
- 7036 Cliffstone Dr
- 7012 Claybeck Dr
Your Personal Tour Guide
Ask me questions while you tour the home.