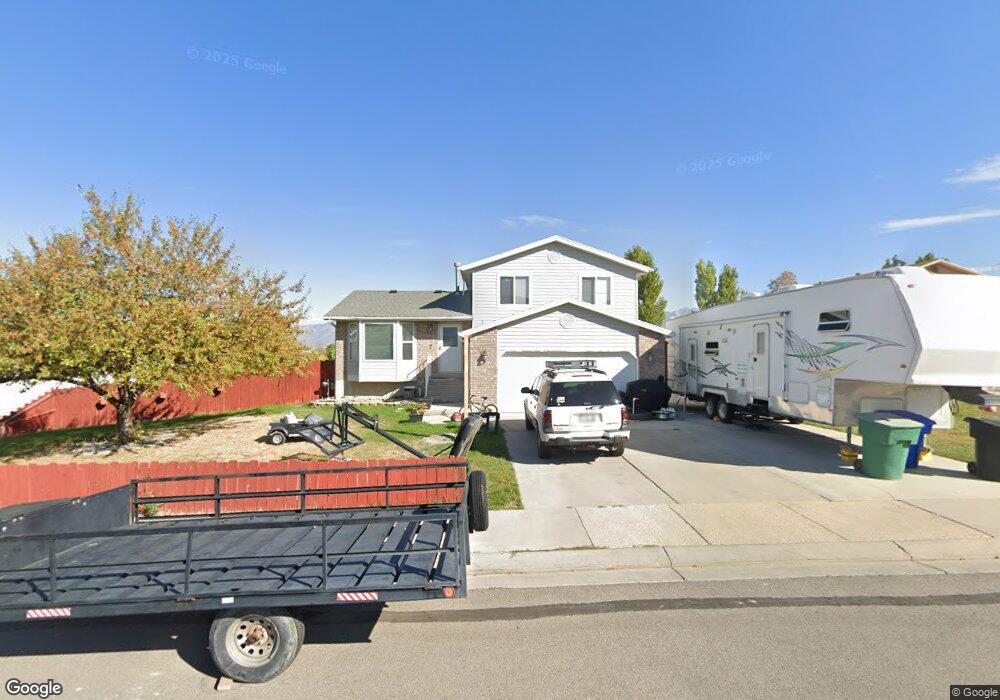
6901 S Coneflower Ct West Jordan, UT 84081
Oquirrh NeighborhoodEstimated Value: $472,000 - $493,006
3
Beds
2
Baths
1,912
Sq Ft
$253/Sq Ft
Est. Value
About This Home
This home is located at 6901 S Coneflower Ct, West Jordan, UT 84081 and is currently estimated at $484,002, approximately $253 per square foot. 6901 S Coneflower Ct is a home located in Salt Lake County with nearby schools including Mountain Shadows School, West Hills Middle School, and Copper Hills High School.
Ownership History
Date
Name
Owned For
Owner Type
Purchase Details
Closed on
Feb 11, 2015
Sold by
Buhler Jason Mark and Buhler Tonya Call
Bought by
Buhler Tonya Call and Buhler Jason Mark
Current Estimated Value
Home Financials for this Owner
Home Financials are based on the most recent Mortgage that was taken out on this home.
Original Mortgage
$164,000
Outstanding Balance
$125,146
Interest Rate
3.66%
Mortgage Type
New Conventional
Estimated Equity
$358,856
Purchase Details
Closed on
Jan 3, 2011
Sold by
Rowley George Wallace and Rowley Lilia
Bought by
Buhler Jason Mark and Buhler Tonya Call
Home Financials for this Owner
Home Financials are based on the most recent Mortgage that was taken out on this home.
Original Mortgage
$170,465
Interest Rate
4.75%
Mortgage Type
FHA
Purchase Details
Closed on
Apr 22, 1994
Sold by
Overstreet Earle Leroy and Overstreet Nedra T
Bought by
Rowley George Wallace and Rowley Lilia
Home Financials for this Owner
Home Financials are based on the most recent Mortgage that was taken out on this home.
Original Mortgage
$102,948
Interest Rate
8.5%
Mortgage Type
VA
Create a Home Valuation Report for This Property
The Home Valuation Report is an in-depth analysis detailing your home's value as well as a comparison with similar homes in the area
Home Values in the Area
Average Home Value in this Area
Purchase History
| Date | Buyer | Sale Price | Title Company |
|---|---|---|---|
| Buhler Tonya Call | -- | Legends Title Llc | |
| Buhler Jason Mark | -- | Titan Title Ins Agcy Inc | |
| Rowley George Wallace | -- | -- |
Source: Public Records
Mortgage History
| Date | Status | Borrower | Loan Amount |
|---|---|---|---|
| Open | Buhler Tonya Call | $164,000 | |
| Closed | Buhler Jason Mark | $170,465 | |
| Previous Owner | Rowley George Wallace | $102,948 |
Source: Public Records
Tax History Compared to Growth
Tax History
| Year | Tax Paid | Tax Assessment Tax Assessment Total Assessment is a certain percentage of the fair market value that is determined by local assessors to be the total taxable value of land and additions on the property. | Land | Improvement |
|---|---|---|---|---|
| 2025 | $2,598 | $465,200 | $131,300 | $333,900 |
| 2024 | $2,598 | $439,200 | $123,800 | $315,400 |
| 2023 | $2,614 | $415,100 | $119,100 | $296,000 |
| 2022 | $2,602 | $410,700 | $116,700 | $294,000 |
| 2021 | $2,291 | $335,800 | $89,800 | $246,000 |
| 2020 | $2,139 | $292,800 | $89,800 | $203,000 |
| 2019 | $2,079 | $278,300 | $84,700 | $193,600 |
| 2018 | $1,954 | $258,100 | $84,700 | $173,400 |
| 2017 | $1,835 | $238,900 | $84,700 | $154,200 |
| 2016 | $1,787 | $218,900 | $84,700 | $134,200 |
| 2015 | $1,755 | $207,300 | $84,500 | $122,800 |
| 2014 | $1,717 | $199,300 | $82,000 | $117,300 |
Source: Public Records
Map
Nearby Homes
- 6928 Beargrass Rd
- 4983 Shooting Star Ave
- 4888 Ticklegrass Rd
- 4891 Calyx Cir
- 6706 Marshrock Rd
- 7232 W Terraine Rd
- 7238 W Terraine Rd
- 7246 W Terraine Rd
- 5208 W Case Mountain Rd
- 5151 Case Mountain Rd
- 4785 Foggio Ct
- 6635 S Milfoil Cir
- 5281 Saguaro Dr
- 7043 Orion Hill Rd
- 7043 S Orion Hill Rd
- 5183 W Cadenza Dr
- 4763 W Arno Way
- 6811 S Etruscan Way
- 6839 S Cyclamen Dr
- 4790 W Barletta Ct
- 6901 Coneflower Ct
- 6911 S Coneflower Ct
- 6911 Coneflower Ct
- 4999 W Ticklegrass Rd
- 4999 Ticklegrass Rd
- 6879 Lyoni Ct
- 6879 S Lyoni Ct
- 6898 Coneflower Ct
- 6912 Coneflower Ct
- 6914 S Lynaria Ct
- 6902 S Lynaria Ct
- 6902 Lynaria Ct
- 6914 Lynaria Ct
- 6921 Coneflower Ct
- 6878 Lyoni Ct
- 6882 S Red Elm Cir
- 6882 Red Elm Cir
- 6878 S Lyoni Ct
- 5043 Ticklegrass Rd
- 6927 Coneflower Ct