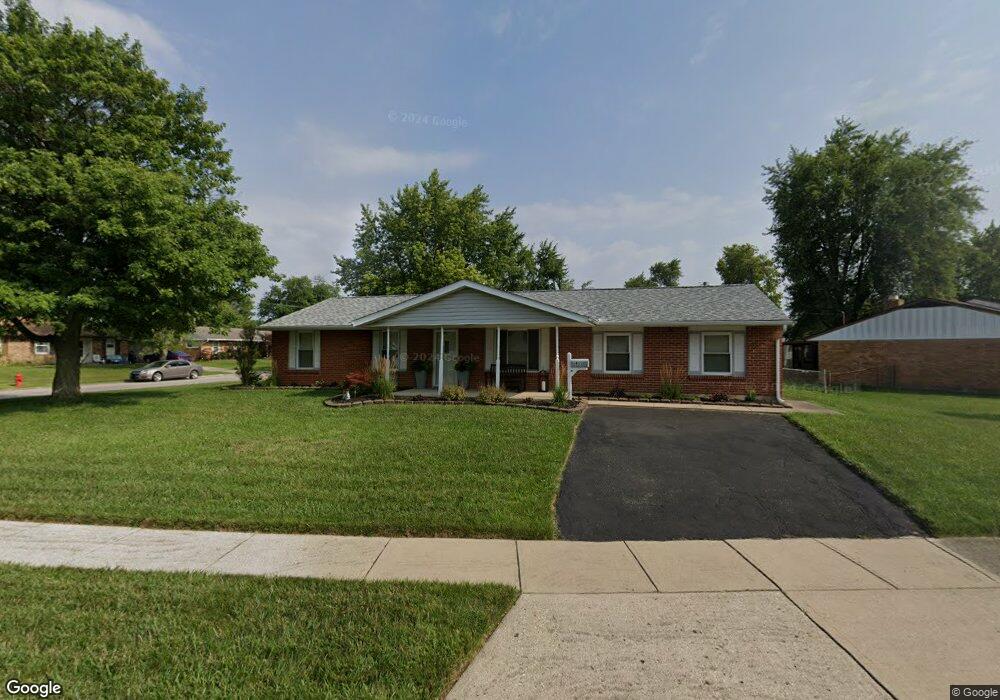
6901 Shellcross Dr Dayton, OH 45424
Estimated Value: $220,000 - $244,000
5
Beds
2
Baths
1,508
Sq Ft
$150/Sq Ft
Est. Value
About This Home
This home is located at 6901 Shellcross Dr, Dayton, OH 45424 and is currently estimated at $226,490, approximately $150 per square foot. 6901 Shellcross Dr is a home located in Montgomery County with nearby schools including Wayne High School and Huber Heights Christian Academy.
Ownership History
Date
Name
Owned For
Owner Type
Purchase Details
Closed on
Nov 12, 2019
Sold by
Smith Leah J
Bought by
Mccollum Justin D
Current Estimated Value
Home Financials for this Owner
Home Financials are based on the most recent Mortgage that was taken out on this home.
Original Mortgage
$133,000
Outstanding Balance
$116,363
Interest Rate
3.65%
Mortgage Type
Purchase Money Mortgage
Estimated Equity
$110,127
Purchase Details
Closed on
Oct 16, 2009
Sold by
Dean Judith A
Bought by
Smith Leah J
Home Financials for this Owner
Home Financials are based on the most recent Mortgage that was taken out on this home.
Original Mortgage
$113,900
Interest Rate
5.07%
Mortgage Type
VA
Purchase Details
Closed on
Sep 30, 2009
Sold by
Estate Of Barry W Dean
Bought by
Dean Judith A
Home Financials for this Owner
Home Financials are based on the most recent Mortgage that was taken out on this home.
Original Mortgage
$113,900
Interest Rate
5.07%
Mortgage Type
VA
Create a Home Valuation Report for This Property
The Home Valuation Report is an in-depth analysis detailing your home's value as well as a comparison with similar homes in the area
Home Values in the Area
Average Home Value in this Area
Purchase History
| Date | Buyer | Sale Price | Title Company |
|---|---|---|---|
| Mccollum Justin D | $140,000 | Sterling Land Title Agcy Inc | |
| Smith Leah J | $113,900 | Attorney | |
| Dean Judith A | -- | None Available |
Source: Public Records
Mortgage History
| Date | Status | Borrower | Loan Amount |
|---|---|---|---|
| Open | Mccollum Justin D | $133,000 | |
| Previous Owner | Smith Leah J | $113,900 |
Source: Public Records
Tax History
| Year | Tax Paid | Tax Assessment Tax Assessment Total Assessment is a certain percentage of the fair market value that is determined by local assessors to be the total taxable value of land and additions on the property. | Land | Improvement |
|---|---|---|---|---|
| 2025 | $3,508 | $65,850 | $10,150 | $55,700 |
| 2024 | $3,388 | $65,850 | $10,150 | $55,700 |
| 2023 | $3,388 | $65,850 | $10,150 | $55,700 |
| 2022 | $2,962 | $45,370 | $7,000 | $38,370 |
| 2021 | $3,005 | $45,370 | $7,000 | $38,370 |
| 2020 | $3,007 | $45,370 | $7,000 | $38,370 |
| 2019 | $2,373 | $31,510 | $7,000 | $24,510 |
| 2018 | $2,381 | $31,510 | $7,000 | $24,510 |
| 2017 | $2,365 | $31,510 | $7,000 | $24,510 |
| 2016 | $2,242 | $29,090 | $7,000 | $22,090 |
| 2015 | $2,213 | $29,090 | $7,000 | $22,090 |
| 2014 | $2,213 | $29,090 | $7,000 | $22,090 |
| 2012 | -- | $31,580 | $8,750 | $22,830 |
Source: Public Records
Map
Nearby Homes
- 7621 Shalamar Dr
- 7611 Shepherdess Dr
- 6857 Pablo Dr
- 7890 Sebring Dr
- 7368 San Fernando Rd
- 6529 Larcomb Dr
- 6566 Highbury Rd
- 6429 Leawood Dr
- 7424 Chatlake Dr
- 6601 Grovehill Dr
- 7302 Belle Plain Dr
- 6483 Highbury Rd
- 7882 Harshmanville Rd
- 7371 Damascus Dr
- 7999 Blackshear Dr
- 6533 Millhoff Dr
- 6730 Alter Rd
- 7356 Natoma Place
- 8286 Briar Ridge Ct
- 6324 Larcomb Dr
- 6905 Shellcross Dr
- 7706 Shalamar Dr
- 7705 Shalamar Dr
- 6909 Shellcross Dr
- 7701 Shalamar Dr
- 6900 Shellcross Dr
- 6904 Shellcross Dr
- 7710 Shalamar Dr
- 7709 Shalamar Dr
- 6908 Shellcross Dr
- 7641 Shalamar Dr
- 6913 Shellcross Dr
- 6912 Shellcross Dr
- 7713 Shalamar Dr
- 7714 Shalamar Dr
- 7655 Sebring Dr
- 6916 Shellcross Dr
- 6901 Summerdale Dr
- 6921 Summerdale Dr
- 7691 Sebring Dr
Your Personal Tour Guide
Ask me questions while you tour the home.