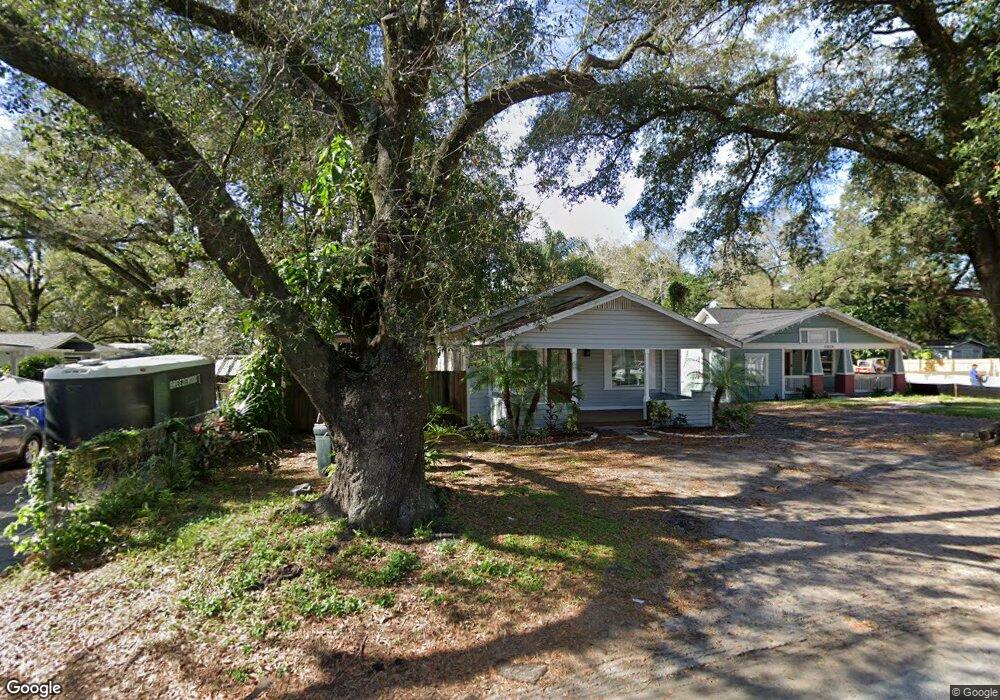
6902 N Duncan Ave Tampa, FL 33604
Seminole Heights NeighborhoodEstimated Value: $250,000 - $359,000
2
Beds
1
Bath
1,400
Sq Ft
$215/Sq Ft
Est. Value
About This Home
This home is located at 6902 N Duncan Ave, Tampa, FL 33604 and is currently estimated at $300,772, approximately $214 per square foot. 6902 N Duncan Ave is a home located in Hillsborough County with nearby schools including Cleveland Elementary School, Adams Middle School, and Chamberlain High School.
Ownership History
Date
Name
Owned For
Owner Type
Purchase Details
Closed on
Apr 26, 2010
Sold by
Cheap Homes Usa Llc
Bought by
Moya Bonifacio Miguel
Current Estimated Value
Purchase Details
Closed on
Apr 13, 2010
Sold by
U S Bank National Association
Bought by
Cheap Homes Usa Llc
Purchase Details
Closed on
Jan 15, 2010
Sold by
Herndon Everette George and Herndon Deloris
Bought by
U S Bank National Association
Purchase Details
Closed on
Dec 31, 2004
Sold by
Spivey Pauline Belle
Bought by
Herndon Everette George and Herndon Deloris
Home Financials for this Owner
Home Financials are based on the most recent Mortgage that was taken out on this home.
Original Mortgage
$85,100
Interest Rate
7.62%
Mortgage Type
Unknown
Purchase Details
Closed on
Apr 12, 1999
Sold by
Spivey Hayward H
Bought by
Spivey L
Create a Home Valuation Report for This Property
The Home Valuation Report is an in-depth analysis detailing your home's value as well as a comparison with similar homes in the area
Home Values in the Area
Average Home Value in this Area
Purchase History
| Date | Buyer | Sale Price | Title Company |
|---|---|---|---|
| Moya Bonifacio Miguel | $30,000 | South Bay Title Ins Agency I | |
| Cheap Homes Usa Llc | $26,000 | Rels Title | |
| U S Bank National Association | -- | Attorney | |
| Herndon Everette George | $85,100 | Transcontinental Title Co | |
| Spivey Pauline Belle | -- | Transcontinental Title Co | |
| Spivey L | $100 | -- |
Source: Public Records
Mortgage History
| Date | Status | Borrower | Loan Amount |
|---|---|---|---|
| Previous Owner | Herndon Everette George | $85,100 |
Source: Public Records
Tax History Compared to Growth
Tax History
| Year | Tax Paid | Tax Assessment Tax Assessment Total Assessment is a certain percentage of the fair market value that is determined by local assessors to be the total taxable value of land and additions on the property. | Land | Improvement |
|---|---|---|---|---|
| 2024 | $2,464 | $178,171 | $60,632 | $117,539 |
| 2023 | $2,334 | $173,829 | $55,120 | $118,709 |
| 2022 | $2,036 | $136,571 | $55,120 | $81,451 |
| 2021 | $1,807 | $105,874 | $38,584 | $67,290 |
| 2020 | $1,573 | $80,877 | $30,316 | $50,561 |
| 2019 | $1,445 | $73,402 | $22,048 | $51,354 |
| 2018 | $1,362 | $70,346 | $0 | $0 |
| 2017 | $1,225 | $59,292 | $0 | $0 |
| 2016 | $1,109 | $45,532 | $0 | $0 |
| 2015 | $964 | $41,393 | $0 | $0 |
| 2014 | -- | $37,630 | $0 | $0 |
| 2013 | -- | $34,209 | $0 | $0 |
Source: Public Records
Map
Nearby Homes
- 7006 N Duncan Ave
- 6917 N Lynn Ave
- 112 W Sligh Ave
- 6904 N Lynn Ave
- 6908 N Lynn Ave
- 115 W Hiawatha St Unit 1/2
- 115 W Hiawatha St
- 207 W Hiawatha St
- 110 W Hiawatha St
- 6810 N Branch Ave
- 209 W Hamilton Ave
- 103 W Hamilton Ave
- 7222 N Ola Ave
- 207 W Thomas St
- 7308 N Dartmouth Ave
- 6812 N Navin Ave
- 6810 N Navin Ave
- 7105 N Navin Ave
- 502 E Cluster Ave
- 7304 N Dixon Ave
- 6904 N Duncan Ave
- 121 W Sligh Ave
- 123 W Sligh Ave
- 6906 N Duncan Ave
- 6901 N Highland Ave
- 6903 N Highland Ave
- 127 W Sligh Ave
- 117 W Sligh Ave
- 6905 N Highland Ave
- 6901 N Duncan Ave
- 6903 N Duncan Ave
- 6910 N Duncan Ave
- 6907 N Highland Ave
- 6905 N Duncan Ave Unit 12
- 115 W Sligh Ave
- 122 W Sligh Ave
- 124 W Sligh Ave
- 122 W Sligh Ave
- 6909 N Highland Ave
- 6907 N Duncan Ave