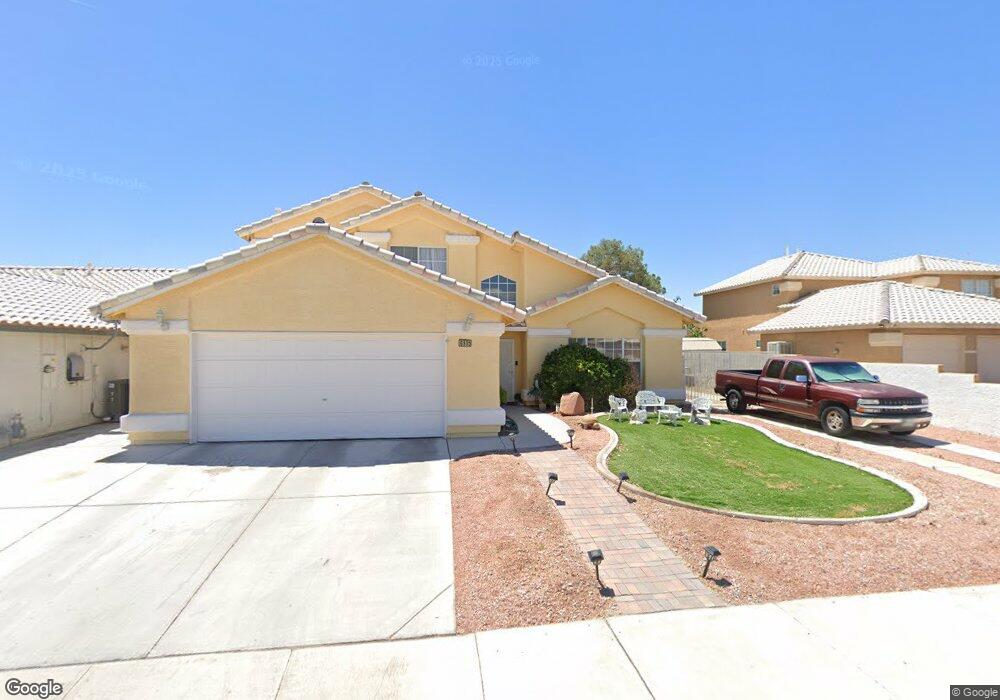
6905 Beach Nest Dr Las Vegas, NV 89130
Estimated Value: $499,666 - $529,000
4
Beds
3
Baths
2,379
Sq Ft
$216/Sq Ft
Est. Value
About This Home
This home is located at 6905 Beach Nest Dr, Las Vegas, NV 89130 and is currently estimated at $513,417, approximately $215 per square foot. 6905 Beach Nest Dr is a home located in Clark County with nearby schools including Joseph M Neal Elementary School, Anthony Saville Middle School, and Shadow Ridge High School.
Ownership History
Date
Name
Owned For
Owner Type
Purchase Details
Closed on
Oct 6, 2020
Sold by
Patterson Adrienne
Bought by
Patterson Kenneth and Patterson Adrienne
Current Estimated Value
Home Financials for this Owner
Home Financials are based on the most recent Mortgage that was taken out on this home.
Original Mortgage
$253,600
Outstanding Balance
$225,564
Interest Rate
2.9%
Mortgage Type
New Conventional
Estimated Equity
$287,853
Purchase Details
Closed on
May 28, 2002
Sold by
Trainor Brenda J and Dods Kevin S
Bought by
Patterson Kenneth and Patterson Adrienne
Home Financials for this Owner
Home Financials are based on the most recent Mortgage that was taken out on this home.
Original Mortgage
$143,920
Interest Rate
7.75%
Purchase Details
Closed on
Mar 31, 1995
Sold by
U S Home Corp
Bought by
Dods Kevin S and Trainor Brenda J
Home Financials for this Owner
Home Financials are based on the most recent Mortgage that was taken out on this home.
Original Mortgage
$121,100
Interest Rate
8.9%
Create a Home Valuation Report for This Property
The Home Valuation Report is an in-depth analysis detailing your home's value as well as a comparison with similar homes in the area
Home Values in the Area
Average Home Value in this Area
Purchase History
| Date | Buyer | Sale Price | Title Company |
|---|---|---|---|
| Patterson Kenneth | -- | Wfg National Title Compan | |
| Patterson Kenneth | $179,900 | Lawyers Title | |
| Dods Kevin S | $151,500 | Stewart Title |
Source: Public Records
Mortgage History
| Date | Status | Borrower | Loan Amount |
|---|---|---|---|
| Open | Patterson Kenneth | $253,600 | |
| Closed | Patterson Kenneth | $143,920 | |
| Previous Owner | Dods Kevin S | $121,100 | |
| Closed | Patterson Kenneth | $35,980 |
Source: Public Records
Tax History Compared to Growth
Tax History
| Year | Tax Paid | Tax Assessment Tax Assessment Total Assessment is a certain percentage of the fair market value that is determined by local assessors to be the total taxable value of land and additions on the property. | Land | Improvement |
|---|---|---|---|---|
| 2025 | $2,207 | $109,429 | $35,000 | $74,429 |
| 2024 | $2,143 | $109,429 | $35,000 | $74,429 |
| 2023 | $1,640 | $105,600 | $34,650 | $70,950 |
| 2022 | $2,281 | $95,572 | $30,450 | $65,122 |
| 2021 | $2,112 | $89,636 | $27,650 | $61,986 |
| 2020 | $1,958 | $88,926 | $27,300 | $61,626 |
| 2019 | $1,835 | $83,522 | $22,400 | $61,122 |
| 2018 | $1,751 | $77,804 | $19,250 | $58,554 |
| 2017 | $2,522 | $76,922 | $17,500 | $59,422 |
| 2016 | $1,640 | $67,458 | $12,600 | $54,858 |
| 2015 | $1,884 | $54,735 | $8,750 | $45,985 |
| 2014 | $1,903 | $47,011 | $7,000 | $40,011 |
Source: Public Records
Map
Nearby Homes
- 5966 Rio Vista St
- 0 Rio Vista St
- 6900 Cloudy Ridge Ct
- 6009 Blowing Bellows St
- 6805 Silver Chisel Ave
- 5912 Grand Heritage St
- 5821 Grand Heritage St
- 5921 Royal Castle Ln
- 5817 Grand Heritage St
- 5917 Kane Holly St
- 5816 Grand Heritage St
- 6131 Rio Vista St
- 6113 Iron Kettle St
- 7237 Grand Palace Ave
- 5667 Foxglove Field St
- 5836 Round Castle St
- 5663 N Balsam St
- 7109 Rancho de Taos Ct
- 7101 Utopia Way
- 6679 Alpine Brooks Ave
- 6909 Beach Nest Ave
- 6909 Beach Nest Dr
- 6901 Beach Nest Dr
- 6904 Cloudy Ridge Ct
- 6908 Cloudy Ridge Ct
- 6821 Beach Nest Ave
- 6821 Beach Nest Dr
- 6913 Beach Nest Dr
- 6904 Beach Nest Dr
- 6900 Beach Nest Ave
- 6900 Beach Nest Dr
- 6820 Cloudy Ridge Ct
- 6912 Cloudy Ridge Ct
- 6908 Beach Nest Dr
- 6817 Beach Nest Ave
- 6817 Beach Nest Dr
- 6820 Beach Nest Dr
- 6912 Beach Nest Dr
- 6816 Cloudy Ridge Ct
- 6816 Beach Nest Dr