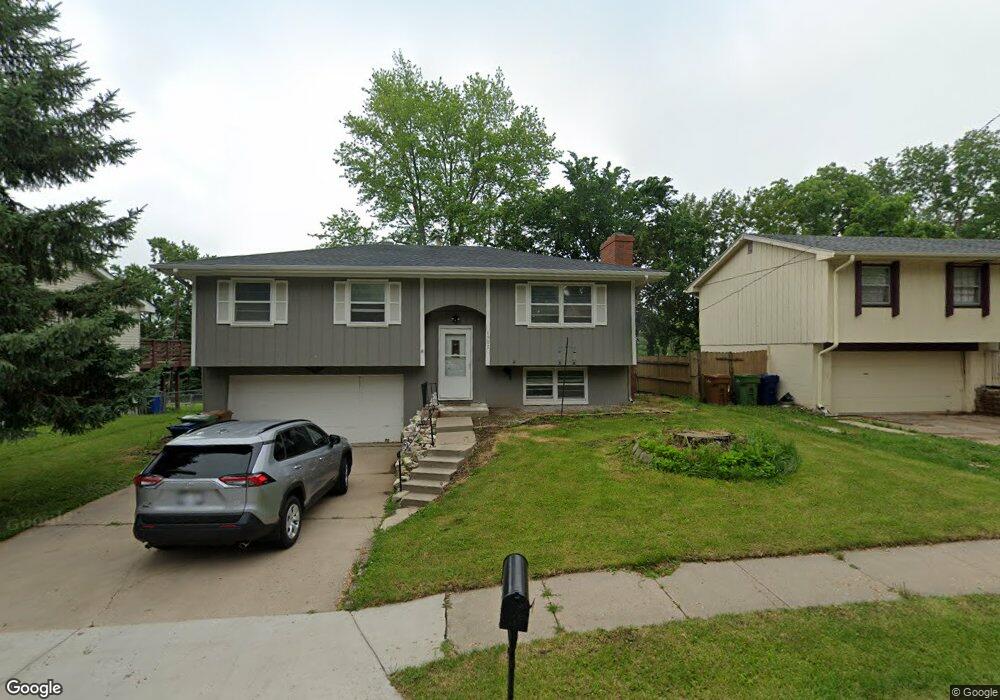
6905 S 32nd Ave Bellevue, NE 68147
Estimated Value: $168,000 - $243,000
3
Beds
2
Baths
1,436
Sq Ft
$149/Sq Ft
Est. Value
About This Home
This home is located at 6905 S 32nd Ave, Bellevue, NE 68147 and is currently estimated at $214,368, approximately $149 per square foot. 6905 S 32nd Ave is a home located in Sarpy County with nearby schools including Gilder Elementary School, Bryan Middle School, and Bryan High School.
Ownership History
Date
Name
Owned For
Owner Type
Purchase Details
Closed on
Apr 2, 2014
Sold by
Paniagua Jose Alfredo
Bought by
A M A Properties Llc
Current Estimated Value
Purchase Details
Closed on
Mar 23, 2010
Sold by
Hsbc Mortgage Services Inc
Bought by
Paniagua Jose Alfredo
Purchase Details
Closed on
Nov 9, 2009
Sold by
Montes Maria and Dominguez Sergio
Bought by
Hsbc Mortgage Services Inc
Purchase Details
Closed on
Sep 28, 2006
Sold by
Richards Allan F and Richards Leslie K
Bought by
Montes Maria
Home Financials for this Owner
Home Financials are based on the most recent Mortgage that was taken out on this home.
Original Mortgage
$129,000
Interest Rate
8.5%
Mortgage Type
Purchase Money Mortgage
Purchase Details
Closed on
Nov 18, 1998
Sold by
Orf Randall J
Bought by
Richards Allan F and Richards Leslie K
Home Financials for this Owner
Home Financials are based on the most recent Mortgage that was taken out on this home.
Original Mortgage
$90,780
Interest Rate
6.81%
Mortgage Type
VA
Create a Home Valuation Report for This Property
The Home Valuation Report is an in-depth analysis detailing your home's value as well as a comparison with similar homes in the area
Home Values in the Area
Average Home Value in this Area
Purchase History
| Date | Buyer | Sale Price | Title Company |
|---|---|---|---|
| A M A Properties Llc | -- | None Available | |
| Paniagua Jose Alfredo | $78,000 | Superior Title & Escrow Llc | |
| Hsbc Mortgage Services Inc | -- | None Available | |
| Montes Maria | $129,000 | Ch | |
| Richards Allan F | $89,000 | -- |
Source: Public Records
Mortgage History
| Date | Status | Borrower | Loan Amount |
|---|---|---|---|
| Previous Owner | Montes Maria | $129,000 | |
| Previous Owner | Richards Allan F | $90,780 |
Source: Public Records
Tax History Compared to Growth
Tax History
| Year | Tax Paid | Tax Assessment Tax Assessment Total Assessment is a certain percentage of the fair market value that is determined by local assessors to be the total taxable value of land and additions on the property. | Land | Improvement |
|---|---|---|---|---|
| 2025 | $3,045 | $187,727 | $30,000 | $157,727 |
| 2024 | $3,631 | $180,502 | $30,000 | $150,502 |
| 2023 | $3,631 | $168,227 | $25,000 | $143,227 |
| 2022 | $3,342 | $153,088 | $25,000 | $128,088 |
| 2021 | $2,948 | $134,182 | $20,000 | $114,182 |
| 2020 | $2,779 | $125,637 | $20,000 | $105,637 |
| 2019 | $2,647 | $119,459 | $20,000 | $99,459 |
| 2018 | $2,594 | $116,198 | $18,000 | $98,198 |
| 2017 | $2,397 | $106,864 | $18,000 | $88,864 |
| 2016 | $2,272 | $102,003 | $18,000 | $84,003 |
| 2015 | $2,191 | $99,188 | $18,000 | $81,188 |
| 2014 | $2,098 | $95,748 | $18,000 | $77,748 |
| 2012 | -- | $93,140 | $18,000 | $75,140 |
Source: Public Records
Map
Nearby Homes
- 7220 Blue Ridge Dr
- 6306 S 31st St
- 7224 Blue Ridge Dr
- 2816 Monroe St
- 3613 Emiline St
- 2831 Lillian St
- 7518 Chandler Acres Dr
- 6230 S 36th Ave
- 7306 Sarpy Ave
- 3110 X St
- 7613 S 34th St
- 7608 S 33rd Ave
- 7612 S 33rd Ave
- 2516 Polk St
- 7304 S 26th St
- 7616 S 33rd Ave
- 2537 Monroe St
- 7731 S 31st St
- 7602 Sarpy Ave
- 7703 S 34th St
- 6909 S 32nd Ave
- 6901 S 32nd Ave
- 6913 S 32nd Ave
- LOT Gertrude St
- Lot 213 & 214 Gertrude St
- 3201 Harrison St
- 6906 S 32nd Ave
- 6917 S 32nd Ave
- 6902 S 32 Ave
- 6910 S 32nd Ave
- 6902 S 32nd Ave
- 6914 S 32nd Ave
- 3218 Harrison St
- 3222 Harrison St
- 3210 Harrison St
- 7001 S 32nd Ave
- 3226 Harrison St
- 3208 Harrison St
- 6918 S 32nd Ave
- 3206 Harrison St