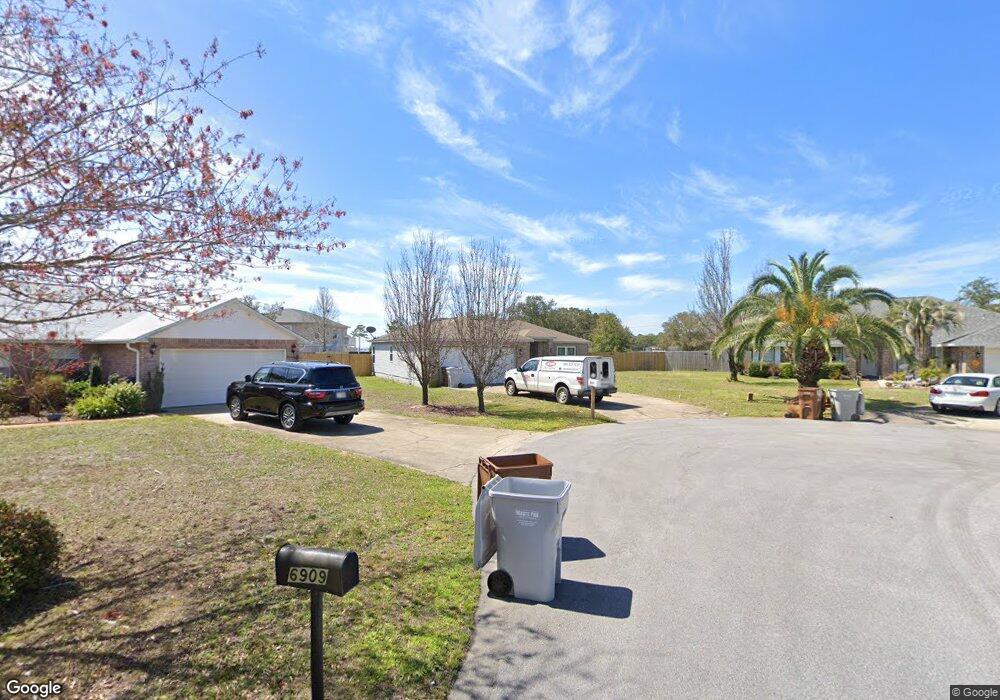
6905 Sea Shark Cir Navarre, FL 32566
Estimated Value: $299,130 - $341,000
3
Beds
2
Baths
1,381
Sq Ft
$234/Sq Ft
Est. Value
About This Home
This home is located at 6905 Sea Shark Cir, Navarre, FL 32566 and is currently estimated at $323,783, approximately $234 per square foot. 6905 Sea Shark Cir is a home located in Santa Rosa County with nearby schools including West Navarre Intermediate School, West Navarre Primary School, and Woodlawn Beach Middle School.
Ownership History
Date
Name
Owned For
Owner Type
Purchase Details
Closed on
Feb 15, 2008
Sold by
Oblack Joseph J and Oblack Ruth M
Bought by
Maxey Melissa D
Current Estimated Value
Home Financials for this Owner
Home Financials are based on the most recent Mortgage that was taken out on this home.
Original Mortgage
$123,750
Outstanding Balance
$75,575
Interest Rate
5.46%
Mortgage Type
Purchase Money Mortgage
Estimated Equity
$248,208
Purchase Details
Closed on
Sep 3, 2003
Sold by
Oblack Ruth M
Bought by
Oblack Joseph J
Purchase Details
Closed on
Nov 17, 1996
Sold by
Windsor Bldr Inc
Bought by
Oblack Ruth M
Purchase Details
Closed on
Mar 15, 1996
Sold by
Tash Beverly
Bought by
Windsor Bldr Inc
Home Financials for this Owner
Home Financials are based on the most recent Mortgage that was taken out on this home.
Original Mortgage
$66,750
Interest Rate
7.03%
Create a Home Valuation Report for This Property
The Home Valuation Report is an in-depth analysis detailing your home's value as well as a comparison with similar homes in the area
Home Values in the Area
Average Home Value in this Area
Purchase History
| Date | Buyer | Sale Price | Title Company |
|---|---|---|---|
| Maxey Melissa D | $165,000 | First American Title Ins Co | |
| Oblack Joseph J | -- | -- | |
| Oblack Ruth M | $92,900 | -- | |
| Windsor Bldr Inc | $17,500 | -- |
Source: Public Records
Mortgage History
| Date | Status | Borrower | Loan Amount |
|---|---|---|---|
| Open | Maxey Melissa D | $123,750 | |
| Previous Owner | Windsor Bldr Inc | $66,750 |
Source: Public Records
Tax History Compared to Growth
Tax History
| Year | Tax Paid | Tax Assessment Tax Assessment Total Assessment is a certain percentage of the fair market value that is determined by local assessors to be the total taxable value of land and additions on the property. | Land | Improvement |
|---|---|---|---|---|
| 2024 | $1,176 | $131,647 | -- | -- |
| 2023 | $1,176 | $127,813 | $0 | $0 |
| 2022 | $1,136 | $124,090 | $0 | $0 |
| 2021 | $1,121 | $120,476 | $0 | $0 |
| 2020 | $1,115 | $118,813 | $0 | $0 |
| 2019 | $1,086 | $116,142 | $0 | $0 |
| 2018 | $1,078 | $113,976 | $0 | $0 |
| 2017 | $1,074 | $111,632 | $0 | $0 |
| 2016 | $1,004 | $109,336 | $0 | $0 |
| 2015 | $1,024 | $108,576 | $0 | $0 |
| 2014 | $1,033 | $107,714 | $0 | $0 |
Source: Public Records
Map
Nearby Homes
- 6913 Sea Shark Cir
- 6918 Sea Turtle Cir
- 6922 Sea Turtle Cir
- 1757 Brooke Beach Dr
- 1709 Brooke Beach Dr
- 1804 Brooke Beach Dr
- 6843 Water St Unit A
- 1736 Shellfish Dr
- 1756 Shellfish Dr
- 0 Water St Unit 650303
- 2531 Cir
- 6958 Elliots Gin Ln
- 6844 Perch St
- Ariana Plan at Navarre - Cornerstone
- Destin Plan at Navarre - Cornerstone
- Eastport Plan at Navarre - Value
- Rosemary Plan at Navarre - Cornerstone
- Caliza Plan at Navarre - Cornerstone
- Eden Plan at Navarre - Cornerstone
- Santa Rosa Plan at Navarre - Cornerstone
- 6900 Sea Shark Cir
- 6909 Sea Shark Cir
- 6904 Sea Crab Cir
- 6908 Sea Shark Cir
- 6904 Sea Shark Cir
- 6925 Sea Shark Cir
- 6900 Sea Crab Cir
- 6908 Sea Crab Cir
- 6912 SEA CRAB Circle Dr
- 6912 Sea Crab Cir
- 6917 Sea Shark Cir
- 6912 Sea Shark Cir
- 6924 Sea Crab Cir
- 6916 Sea Crab Cir
- 6905 Sea Trout Cir
- 6905 Sea Crab Cir
- 6916 Sea Shark Cir
- 6909 Sea Crab Cir
- 0 Sea Crab Cir
- 6921 Sea Shark Cir